-- Published: Friday, 21 November 2014 | Print | Disqus
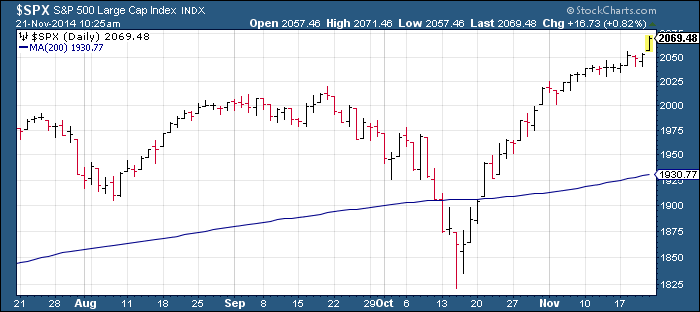
As several market technicians have pointed out recently, price oscillators and sentiment indicators for the U.S. stock market point to an excessively overbought condition, both technically and psychologically. To take just one instance of how overstretched the market has become, take a look at the following chart which shows the SPX in relation to its 200-day moving average. The 200-day MA is widely followed by small investors and big money managers alike.
While most participants prefer seeing the SPX trading above the 200-day MA, whenever the S&P has gotten over-extended from the trend line it has set up a period of (temporary) underperformance. The last such instance of an overstretched SPX occurred in the weeks leading up to the autumn decline.
Another important indicator which highlights the current sentiment profile of individual investors is the American Association of Individual Investors (AAII) bull/bear survey. The AAII bull/bear ratio last week reached its most pronounced level of investor optimism in years with 60 percent of respondents bullish versus only 19 percent bearish on the stock markets interim prospects. With so many bulls and so few bears the question that begs to be asked is: What will happen when the buyers finally stop buying and there is no new buying power to boost the major averages?
Its easy to see that investors are almost uniformly bullish with hardly any bears to be found, and thats a condition that normally doesnt long persist without a market pullback. Whether the next market correction takes the form of a short, sharp decline or a lateral consolidation (i.e. trading range) is open for debate, though. Internal momentum is still running strong, though, which should prevent a sell-off of the magnitude we saw in late September/early October. Instead, the markets next correction phase could be surprisingly shallow or perhaps even take the form of an internal correction where a few high-profile stocks get shot down while the major averages remain buoyant.
The one group of investors (other than the perma-bears) that havent bought into this rally is value investors. Theyre licking their chops as they wait for what they think will be a major market decline so they can jump in and scoop up shares at a relative bargain. They may well be disappointed, however, especially if the next market correction is as shallow as I think it will be.
By the same token, the bears will be even more disappointed if the big decline theyre expecting either doesnt materialize or is much less severe than theyre expecting. This in turn would provide the backdrop for another major short-covering rally. Although the market has been very overbought lately the markets overbought condition followed close on the heels of a record oversold condition. Normally when the market goes quickly from oversold to overbought it tends to be net bullish for the intermediate-term outlook.
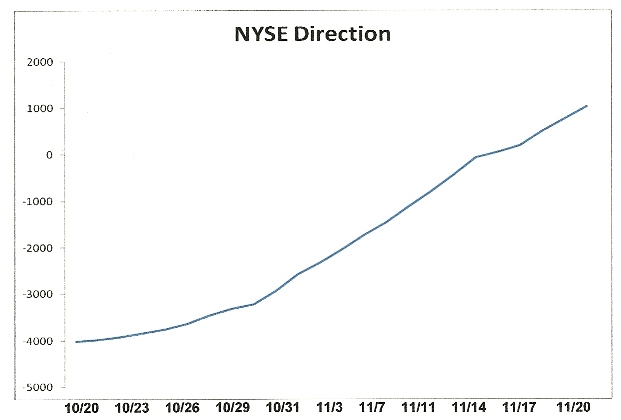
Short-term internal momentum on the NYSE continues to strengthen, which explains why the major indices arent pulling back despite stocks being overbought. Below is the chart showing the NYSE short-term momentum bias indicator, an important gauge of the markets near-term path of least resistance. With this indicator rising as consistently as it has in recent weeks it has acted as a prod to the bulls and a thorn in the side of the bears.
The sub-dominant and dominant intermediate-term internal momentum indicators havent been as lively, however. The blue line in the following graph represents the former while the red line represents the latter.
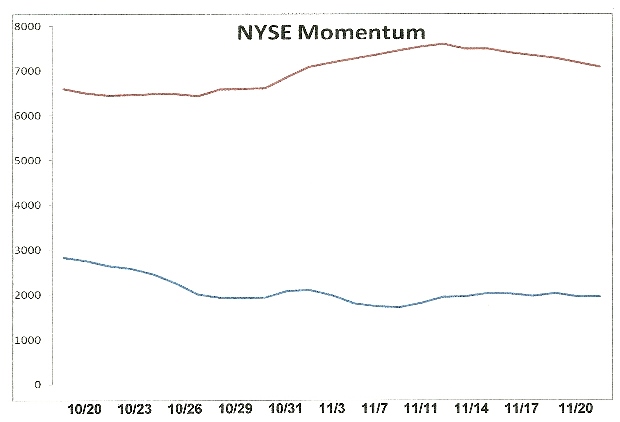
As you can see in the above chart, these two components of the NYSE internal momentum index could use some improvement. The stock market clearly hasnt been firing on all cylinders, which explains why the rally hasnt been quite as vigorous as it was a few weeks ago.
If nothing else, the next market correction phase should work out some of the internal kinks within the NYSE broad market and allow the internal momentum indicators to get back in synch as the bull market continues.
Mastering Moving Averages
The moving average is one of the most versatile of all trading tools and should be a part of every investors arsenal. The moving average is one of the most versatile of all trading tools and should be a part of every investors arsenal. Far more than a simple trend line, its a dynamic momentum indicator as well as a means of identifying support and resistance across variable time frames. It can also be used in place of an overbought/oversold oscillator when used in relationship to the price of the stock or ETF youre trading in.
In my latest book, Mastering Moving Averages, I remove the mystique behind stock and ETF trading and reveal a completely simple and reliable system that allows retail traders to profit from both up and down moves in the market. The trading techniques discussed in the book have been carefully calibrated to match todays fast-moving and sometimes volatile market environment. If youre interested in moving average trading techniques, youll want to read this book.
Order today and receive an autographed copy along with a copy of the book, The Best Strategies For Momentum Traders. Your order also includes a FREE 1-month trial subscription to the Momentum Strategies Report newsletter:
http://www.clifdroke.com/books/masteringma.html
Clif Droke is a recognized authority on moving averages and internal momentum. He is the editor of the Momentum Strategies Report and Gold & Silver Stock Report newsletters, published since 1997. He has also authored numerous books covering the fields of economics and financial market analysis. His latest book is Mastering Moving Averages. For more information visit www.clifdroke.com
| Digg This Article
-- Published: Friday, 21 November 2014 | E-Mail | Print | Source: GoldSeek.com