Elites set to wipe out shorts before next downwave
By: Clive Maund
-- Published: Monday, 1 February 2016 | Print | Disqus
The recovery rally in the US stockmarket that we have been expecting for a week or two started on Friday with a robust advance that gathered strength into the close. The trigger was Japans announcement that it is going into NIRP (Negative Interest Rate Policy) in a big way, which means that as they slip deeper into the abyss of bankruptcy they are going to resort to robbing savers. This is real endgame stuff another milestone on the road to ruin, and it looks like it was the result of the Japanese attendees at Davos being taken to one side and given their marching orders. The US stockmarket reveled in this news of course, because it means that the Feds proposed interest rate rises will never happen and instead they will get ready to launch a massive QE blitz, in concert with Central Banks around the world, in a desperate effort to fend off the gathering forces of deflation. The end result of this QE blitz will be hyperinflation and chaos. At some point the penny will drop with investors and there will be a stampede into gold and silver, although latest COTs suggest that this is still some way off.
On the 6-month chart for the S&P500 index, we can see how the index finally broke out upside from an intermediate base pattern on Friday, with a big bullish white candle appearing. The large white candle portends a continuation of the rally. First stop should be the resistance shown in the 2000 area, and it may well rise further, as we will see on other charts, with a fairly precise target for the move provided by the chart for the Dow Jones Transports, which we will look at later.
On the 2-year chart for the S&P500 index we can see more clearly how far this countertrend rally is likely to get. The first stop will be the resistance shown in the 2000 area, as pointed out above, but the vigor of Fridays advance suggests that it is quite likely that it will push on higher to the Dome boundary again, as it did after the August plunge. That the market is rallying here should hardly be surprising, given that it had dropped to become extremely oversold on its MACD indicator and at a zone of support at the lower boundary of its large Head-and-Shoulders top.
The 5-year chart shows the big picture, and what is likely to happen after the index reaches the Dome boundary again, if it gets that far.
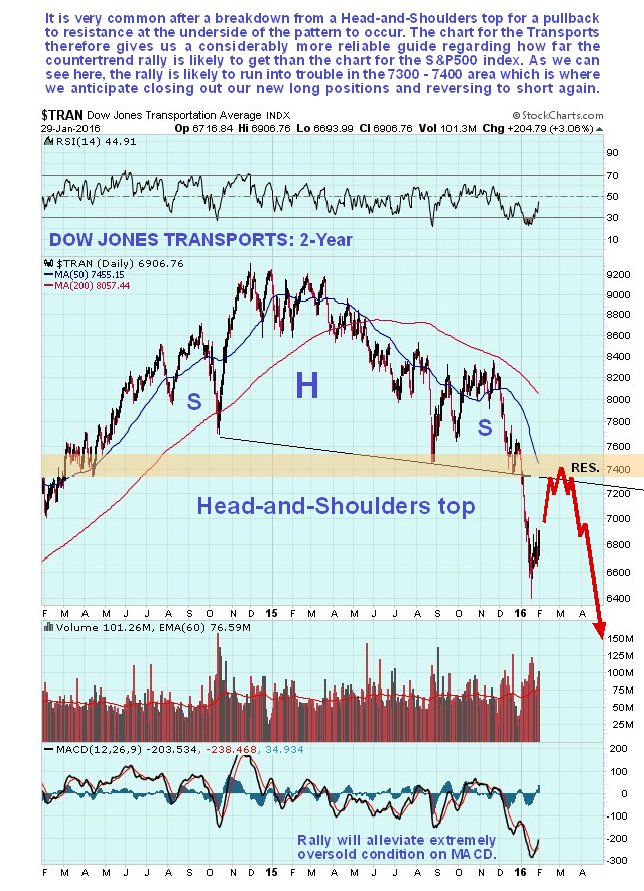
Whilst it is rather tricky to determine how far this countertrend rally will get on the charts for the S&P500 index, happily this is not the case with the chart for the Dow Jones Transports, which provides us with a fairly precise target, as we will now see.
On the 2-year chart for the Transports, we can see that after it broke down from the clear Head-and-Shoulders top right at the start of the month, it plunged to become extremely oversold. Now, it is very common after a breakdown from a Head-and-Shoulders top for a pullback to the neckline of the pattern to occur, before the bearmarket that it portends gets underway in earnest. After the basing action of the past couple of weeks that is what it looks like we are now going to see, in which case the Transports will rally back up to the 7300 7400 area in coming weeks, where we will offload our short-term long positions and probably go heavily short. Thats the plan lets see what happens.
Now here are some other indicators that back up our contention that a sizeable countertrend rally has just started.
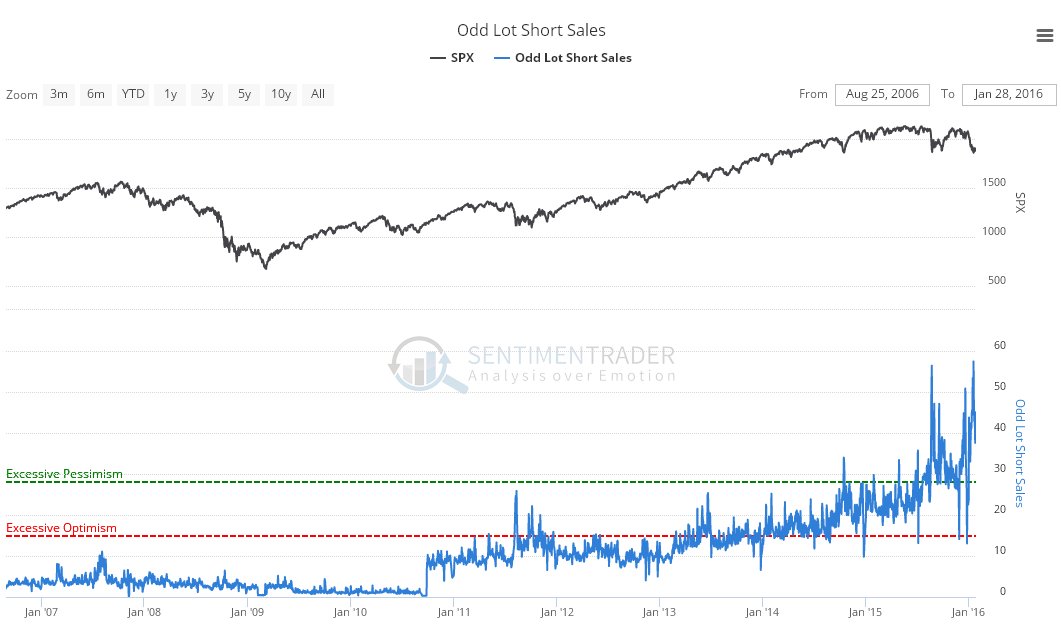
First we have the latest Odd Lot Short Sales chart, which shows that almost everyone has been piling in on the short side in recent weeks, and since that many people cant be right it follows that Big Money will now fleece these shorts by engineering a sizeable short-covering rally. Once they have been wiped out the market will be free to drop again.
Click on chart to popup a larger, clearer version.
Chart courtesy of www.sentimentrader.com
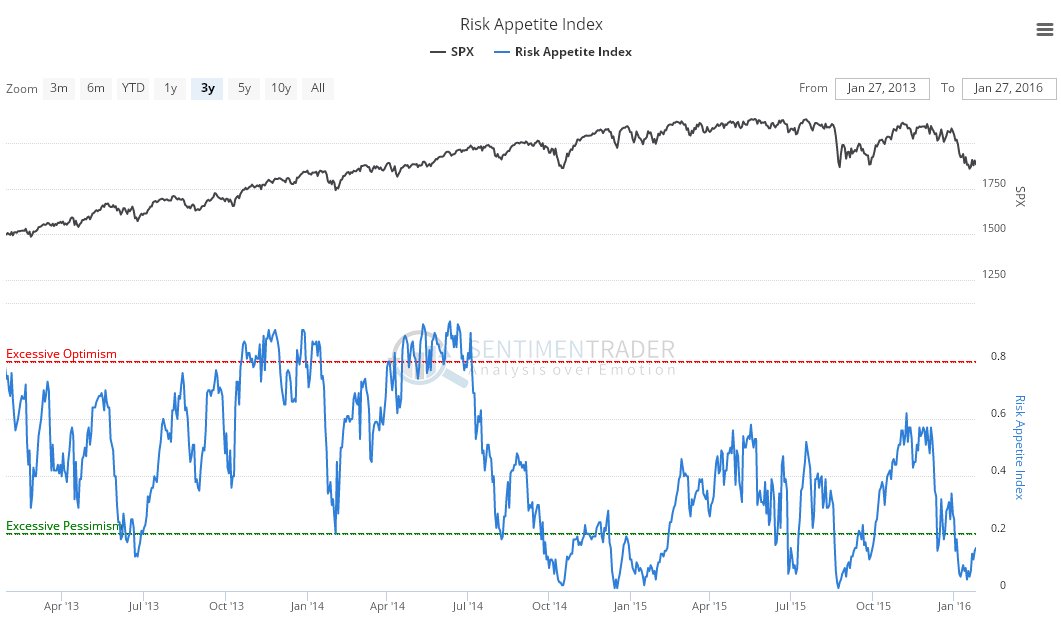
The extremely low appetite for risk of the past couple of weeks is another indication that the market is ripe for a rally, as we can see on the latest Risk Appetite Index shown below.
Click on chart to popup a larger, clearer version.
Chart courtesy of www.sentimentrader.com
Since 2008 we have been traversing the eye of a gigantic financial hurricane, and you may recall that it was pointed out on the site back in November that the eyewall at the back side of this storm was about to hit, as we can see to advantage on this photo from the International Space Station, and we can also see how NIRP will precede the final acts of desperation of a broken system bail-ins and the brazen looting of pension funds
In a separate article we will be looking at some vehicles for making money on the long side during the expected rally in coming weeks, before piling on the shorts again.
The content on this site is protected
by U.S. and international copyright laws and is the property of GoldSeek.com
and/or the providers of the content under license. By "content" we mean any
information, mode of expression, or other materials and services found on GoldSeek.com.
This includes editorials, news, our writings, graphics, and any and all other
features found on the site. Please contact
us for any further information.
Live GoldSeek Visitor Map | Disclaimer
The views contained here may not represent the views of GoldSeek.com, Gold Seek LLC, its affiliates or advertisers. GoldSeek.com, Gold Seek LLC makes no representation, warranty or guarantee as to the accuracy
or completeness of the information (including news, editorials, prices, statistics,
analyses and the like) provided through its service. Any copying, reproduction
and/or redistribution of any of the documents, data, content or materials contained
on or within this website, without the express written consent of GoldSeek.com, Gold Seek LLC,
is strictly prohibited. In no event shall GoldSeek.com, Gold Seek LLC or its affiliates be
liable to any person for any decision made or action taken in reliance upon
the information provided herein.