-- Published: Sunday, 7 August 2016 | Print | Disqus
Because it is now politically incorrect to be bearish on gold, it makes it more likely that a sizeable correction will occur soon, and there are a number of technical indicators at extremes suggesting that a correction is imminent, which we will look at in this update.
Well start by looking at golds latest charts beginning with the 3-month. On this chart we see that gold made only very limited gains following its Brexit vote surge, and it has just failed at resistance at its early July high, with a sizeable down day on Friday, so that it is now stuck in a rectangular trading range, which could be either a continuation pattern or an intermediate top.
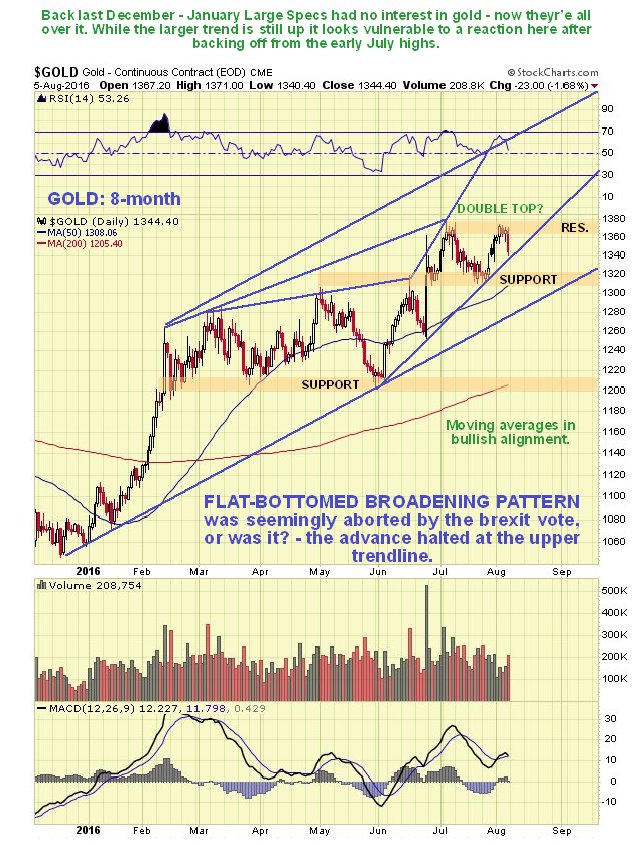
The 8-month chart shows all of the action since golds new bullmarket commenced following its December low. Overall, this chart looks positive, with a steady, measured advance following the January February surge, although it perhaps surprising to learn, given what has happened to Precious Metals stocks during this period, that gold has only risen by about $100 since its February peak, a period of a little less than 6-months. Breaking it down we can see that a flat-bottomed Broadening Formation developed following the January February surge, which is normally bearish, but it appeared to break out of it to the upside on the Brexit vote, which really put the cat among the pigeons, although this pattern may have a higher boundary shown by the upper trendline, in which case it hasnt. However, since this possible breakout it has moved sideways in a rectangular pattern with clearly defined support and resistance, and is now at an important juncture it needs to hold this breakout to maintain upward momentum, which is made more likely by seasonal factors, which are now positive, but a breach at the support at the lower boundary of the Rectangle could trigger a sharp selloff, and this is made more likely by current COT extremes and PM stock sentiment extremes, and the fact that gold has arrived at an important target on its 10-year artithmetic chart, which we will now proceed to look at.
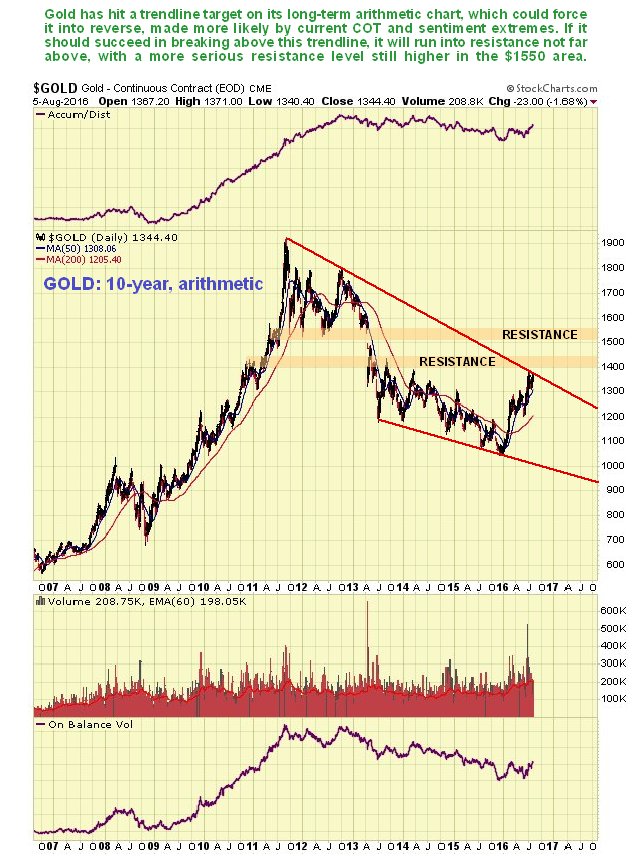
The 10-year arithmetic gold chart provides useful perspective as it enables us to see the bearmarket from 2011 in its entirety, which might also be viewed as simply a big correction within a major bullmarket, similar to the correction in the middle of the great 1970s bullmarket. On this chart we see that gold has arrived at a trendline target, which is a good point for it to react back, which is made more likely by the latest extreme COT and sentiment readings. Should it succeed in breaking above this trendline, there is a resistance level not far above, and more serious resistance further up in the $1550 area.
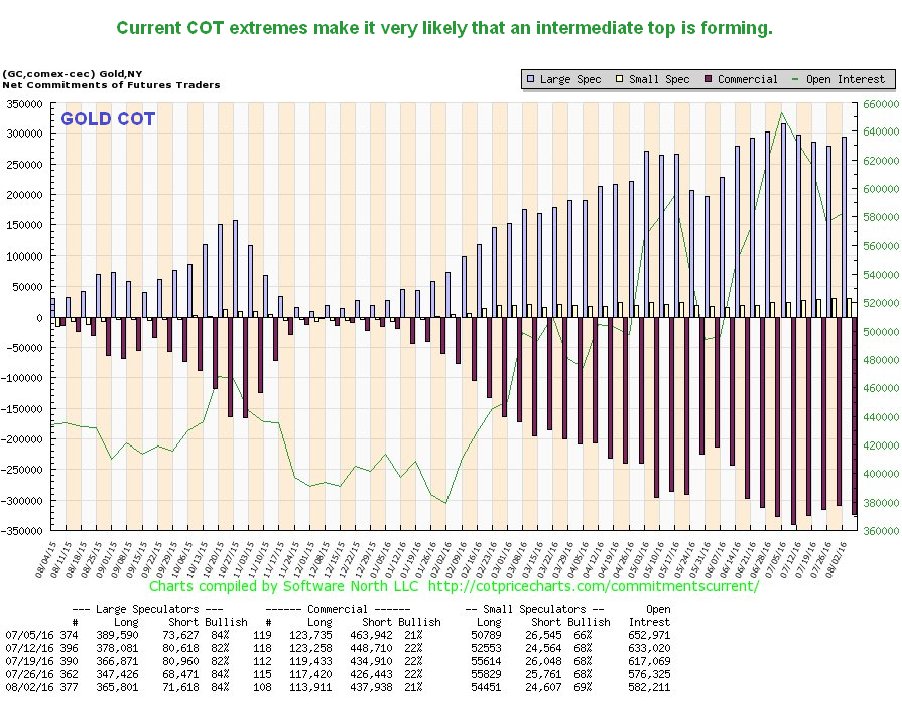
The latest COT chart shows that very high Commercial short and Large Spec long positions persist. The way to look at this is to think of it as you would a pendulum the further it swings in one direction, the more likely it is to reverse and head back in the other direction, which it will do of course when gold drops in price. It is noteworthy that when gold was bottoming last December, the Large Specs had virtually no interest in it, but now it has risen by $300 they are all over it, which we take as a warning.
Click on chart to popup a larger clearer version.
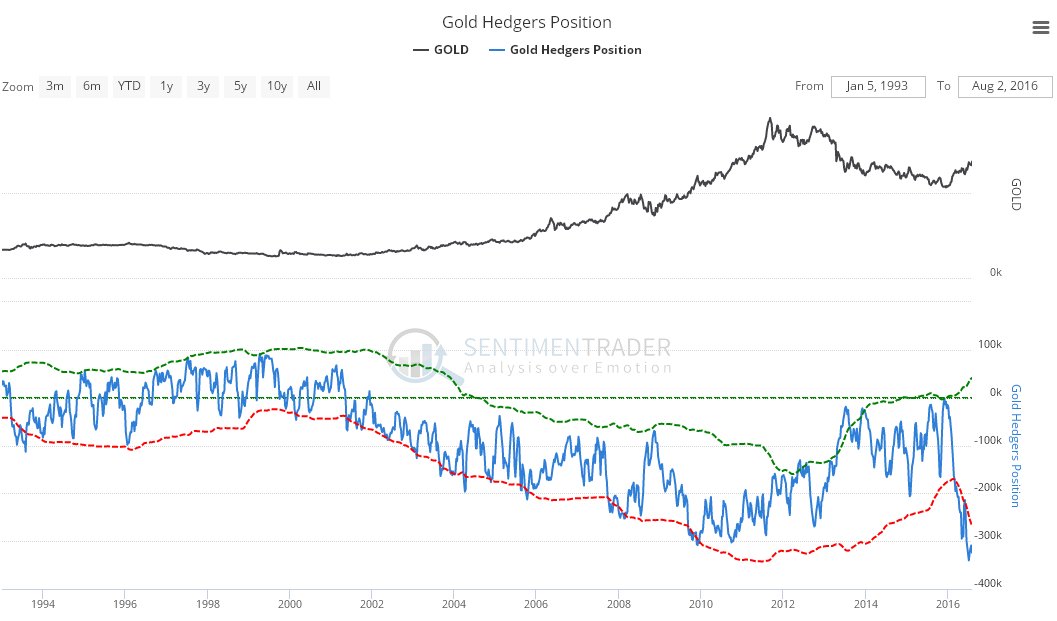
The current COT extremes are put into long-term context on the Hedgers chart, which is a form of COT chart. Such readings usually, but not always occur at a top or ahead of a reaction or period of consolidation. On rare occasions they dont, and there are many who claim that its different this time. This is a dangerous expression that has gotten a lot of people into a lot of trouble, but we can easily see why it really might be this time, with the world economy teetering on the verge of a collapse that may only be delayed by the advent of helicopter money and the drift towards major wars etc. Even so, these things dont happen all at once, and a correction could occur in the meantime.
Click on chart to popup a larger clearer version.
Chart courtesy of www.sentimentrader.com
While golds advance since mid-February has been at a measured rate, the same cannot be said for Precious Metals stocks, which have continued in higher within a quitter strong uptrend, as we can see on the 8-month chart for the GDX below. The reason for this is that gold and silver stocks had become ridiculously undervalued relative to the metals, and furthermore, surviving producers had slimmed down their operations and reduced costs as much as possible, which meant that any improvement in metal prices would flow straight through to their respective bottom lines, so the big improvement in prices is justified.
However, any retrace by gold is likely to lead to a breach of the uptrend in PM stocks and a possibly steep reaction. This is made more likely by the fact that the vast majority of investors are now bullish on the PM sector, with a current 89% bullish reading, after 100% at the start of July, as revealed by the Gold Miners Bullish % Index shown below. Although it has eased somewhat, the current reading is still very high and increases the risk of a significant correction soon. Holders of PM stocks at this point can either take some profits here, or buy on a dip to the lower channel boundary, with a close stop beneath it, and take profits in a more serious manner if the clearly defined uptrend fails.
The content on this site is protected
by U.S. and international copyright laws and is the property of GoldSeek.com
and/or the providers of the content under license. By "content" we mean any
information, mode of expression, or other materials and services found on GoldSeek.com.
This includes editorials, news, our writings, graphics, and any and all other
features found on the site. Please contact
us for any further information.
Live GoldSeek Visitor Map | Disclaimer
The views contained here may not represent the views of GoldSeek.com, Gold Seek LLC, its affiliates or advertisers. GoldSeek.com, Gold Seek LLC makes no representation, warranty or guarantee as to the accuracy
or completeness of the information (including news, editorials, prices, statistics,
analyses and the like) provided through its service. Any copying, reproduction
and/or redistribution of any of the documents, data, content or materials contained
on or within this website, without the express written consent of GoldSeek.com, Gold Seek LLC,
is strictly prohibited. In no event shall GoldSeek.com, Gold Seek LLC or its affiliates be
liable to any person for any decision made or action taken in reliance upon
the information provided herein.