The Growing Threat of a Deflationary Meltdown and a Big Dollar Rally
By: Clive Maund
-- Published: Sunday, 9 October 2016 | Print | Disqus
Last week saw a shocking plunge by gold and silver. While this is being classed in many quarters as part of a corrective phase in force since last July, and possibly the last part, the ferocity of this decline may have deeper implications, which is what we are going to look at here.
The sharp break lower by gold may be telegraphing a strong advance by the dollar, and last week, as gold plunged early in the week and continued lower later in the week, the dollar pressed higher and broke above nearby resistance, which might be a prelude to an upside breakout from the 18-month long trading range in the dollar. At the same time a truly frightening pattern appears to be completing in the broad market S&P500 index, which is now increasingly vulnerable to a brutal plunge.
Putting all these major pieces of the puzzle together, it looks like we are in for another 2008 style deflationary episode, which this time will be much worse, because rates are already at zero, and there is no-one left to resort to for a bailout. The only palliative that can be resorted to is immediate helicopter money drops which will eventually lead to hyperinflation. It is presumed that such a deflationary episode will be triggered by the failure a major bank or banks or something similar, which is certainly very possible considering the trouble they are in, especially in Europe. In the absence of emergency measures such as helicopter money the economy will simply implode, with banks slamming their doors, ATMs ceasing to function, supply and distribution networks breaking down, quickly leading to a widespread state of anarchy.
Well now go through the charts and attempt to put the larger pieces of the puzzle together.
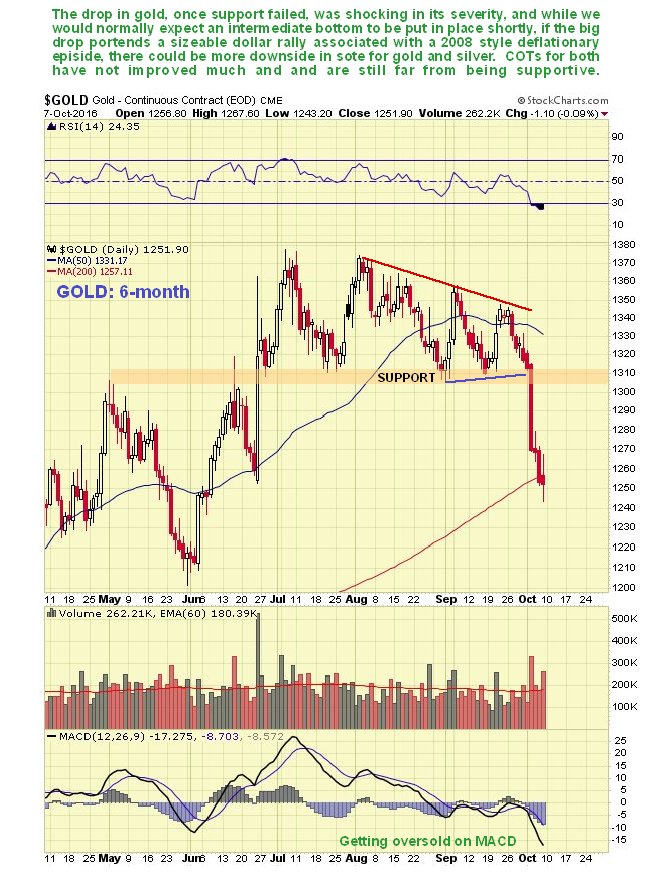
Starting with the 6-month chart for gold, we can see the dramatic breakdown early last week. Normally, with the price dropping back into a rising 200-day moving average, we would expect it to bottom here or soon but not if we spiral into a deflationary meltdown, as we may be about to remember what happened to gold and silver in 2008?
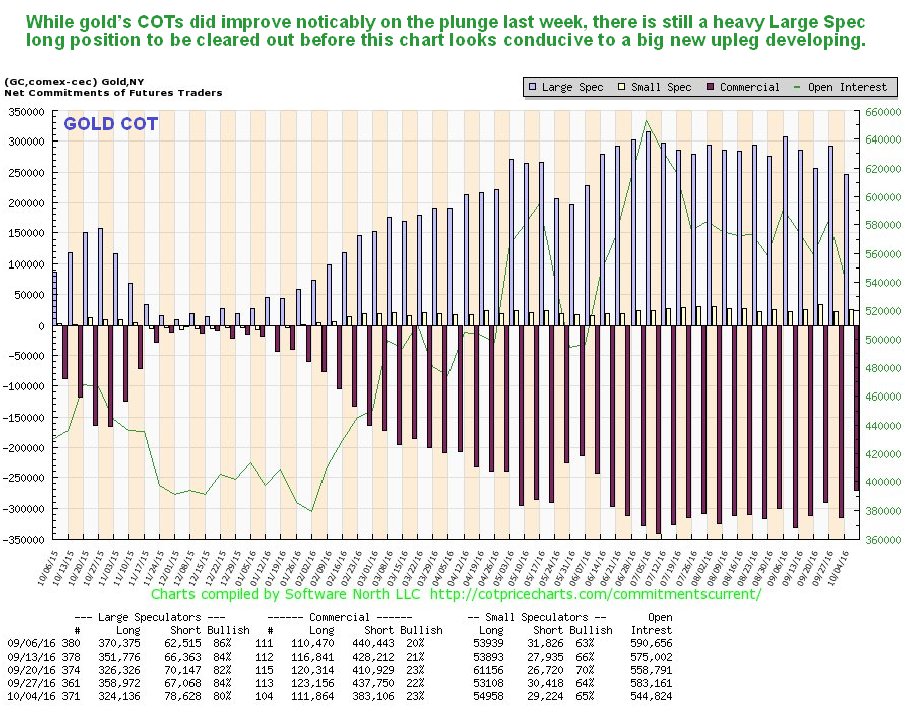
In itself, the latest COT is not supportive of a renewed rally in gold. While positions did ease significantly last week, there is still a heavy Large Spec long position overhang that would need to be cleared out before we can forward to another major rally in gold.
Click on chart to popup a larger clearer version.
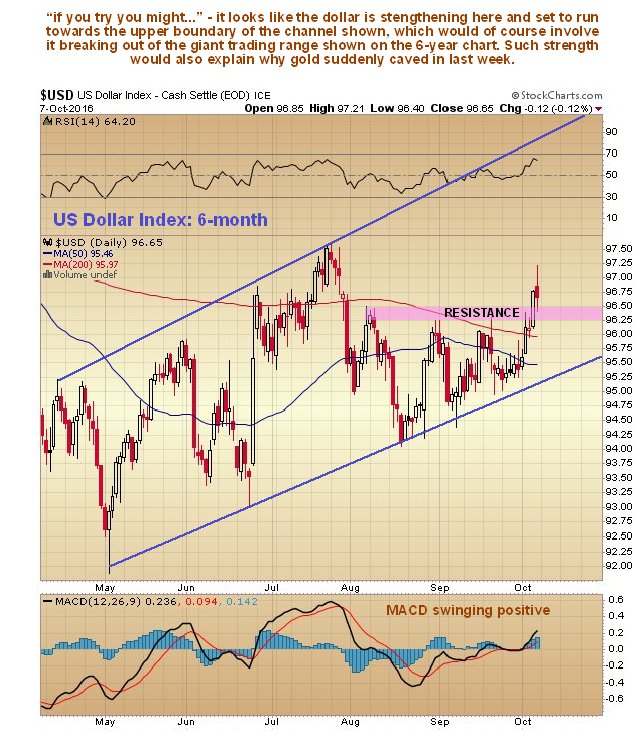
Meanwhile the dollar appears to be strengthening and last week it broke above the resistance shown on the 6-month dollar index chart below, and if it were to make a run at the top of the uptrend channel shown, it would involve it breaking out the top of the giant trading range it has been stuck for about 18 months now. Note the MACD indicator swinging into positive territory and how, should the current advance continue, its moving averages will quickly swing into bullish alignment.
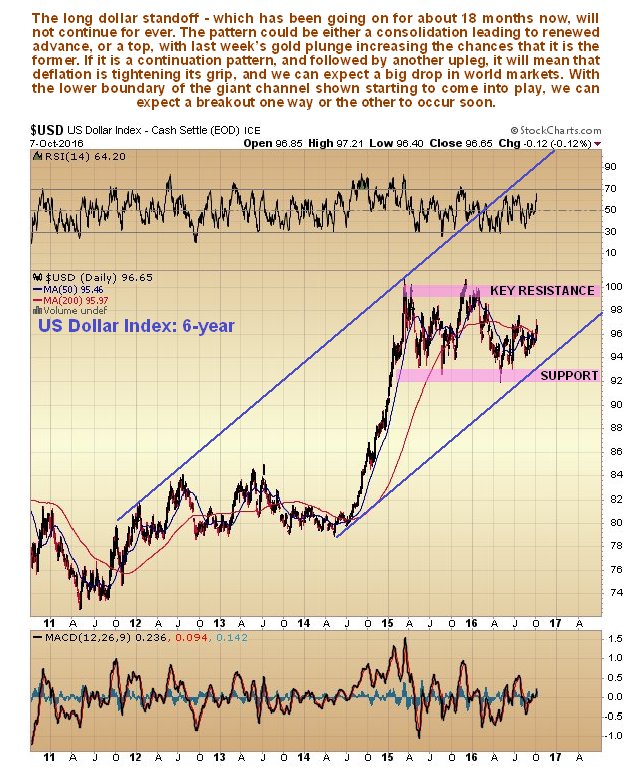
On the 6-year dollar index chart we can see to advantage how, after a powerful bullmarket from mid-2014 through the Spring of 2015, the dollar has run off sideways in a giant trading range that could be either a consolidation pattern or a top, and the way its looking now it is the former. Clearly, this pattern cannot continue forever, and with the lower boundary of the large uptrend channel now starting to come into play, we can expect to see a breakout one way or the other soon.
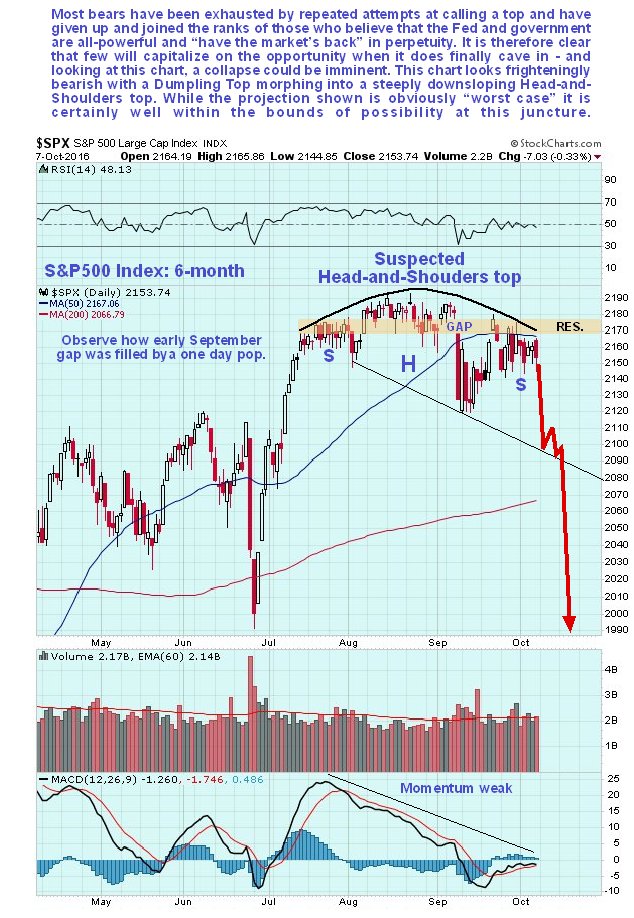
Another big piece in the puzzle is the US stockmarket, and the pattern now appearing to be completing on the S&P500 index looks truly frightening, for it would appear that the formation that we had earlier identified as a Dumpling Top is also a sharply downsloping completing Head-and-Shoulders top that threatens a severe decline imminently. There are a couple of interesting technical points to observe on this chart. One is how the advance from the mid-September trough was halted and turned back exactly at the cap or lid of the Dumpling Top, right after it had filled the gap created when the market plunged early in September. Another is the increased volatility over the past week or so, with wider swings, which often occurs ahead of a serious breakdown.
The conclusion to all this is that we may be about to sink into a serious deflationary episode, similar to what occurred in 2008, only much worse, because there is nothing to fall back on to stop this time, except helicopter money which we can expect to be invoked when the situation becomes sufficiently serious to force action. This is thought to be a big reason that they are trying to get a war started with Russia, to stimulate the economy by putting it on a war footing and to give the masses an external enemy on which to vent their wrath, rather than on the government at home.
The content on this site is protected
by U.S. and international copyright laws and is the property of GoldSeek.com
and/or the providers of the content under license. By "content" we mean any
information, mode of expression, or other materials and services found on GoldSeek.com.
This includes editorials, news, our writings, graphics, and any and all other
features found on the site. Please contact
us for any further information.
Live GoldSeek Visitor Map | Disclaimer
The views contained here may not represent the views of GoldSeek.com, Gold Seek LLC, its affiliates or advertisers. GoldSeek.com, Gold Seek LLC makes no representation, warranty or guarantee as to the accuracy
or completeness of the information (including news, editorials, prices, statistics,
analyses and the like) provided through its service. Any copying, reproduction
and/or redistribution of any of the documents, data, content or materials contained
on or within this website, without the express written consent of GoldSeek.com, Gold Seek LLC,
is strictly prohibited. In no event shall GoldSeek.com, Gold Seek LLC or its affiliates be
liable to any person for any decision made or action taken in reliance upon
the information provided herein.