-- Published: Sunday, 3 December 2017 | Print | Disqus
I would no sooner invest without using charts than I would drive down a freeway at 90 miles per hour with my head in a blindfold or a brown paper bag. What would you think if the Weatherman came on the TV and instead of showing you a chart, presented you with a table of data? or you boarded a plane with the windows shuttered and the Captain explaining Oh I dont need to see out my instruments provide me with all the information I need to fly the plane.? Charts are about perspective and proportion, and without them youve got none.
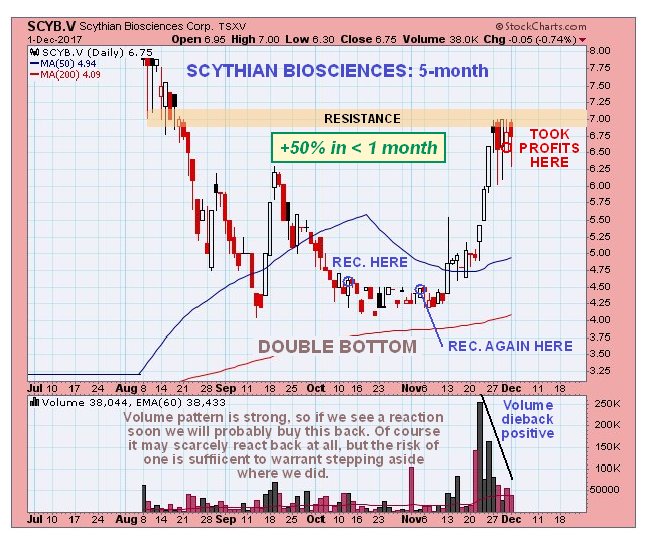
By the time you are done reading this review you will, or should be if you are reasonable, be left in no doubt about the awesome money making power of charts, properly used. On clivemaund.com our investing strategy is simple, we go where the action is. Until 2011 some of the best gains were to be made in the Precious Metals space and we tracked that sector closely during its bullmarket. Then it changed and in more recent times the action has shifted to biotech, blockchain and cryptocurrencies, and marijuana, Tech generally and the FANGS etc. Because we go where the action is, that is why we are able to make the big gains you will see set out below on a regular basis. The charts presented below are color coded blue for Oil, coral for Biotech, green for Marijuana and yellow and white for Blockchain, a sector we are just moving into. Because these charts are largely retrospective the usual indicators appended above and below them have been removed to save space and reduce clutter. Note that clicking on the company name will take you to the most relevant report on its stock on clivemaund.com where the password protection has been removed in order that you are able to open it. Now read on Biotech & Medical Stocks We just closed a nice trade in Scythian. We spotted that a Double Bottom was forming above its rising 200-day moving average, accompanied by a positive volume pattern, so bought it on a couple of occasions as it marked out the 2nd low of the pattern. Took profits last week after it had arrived at a resistance level in an overbought state Scythian Biosciences SCYB.V C$6.75
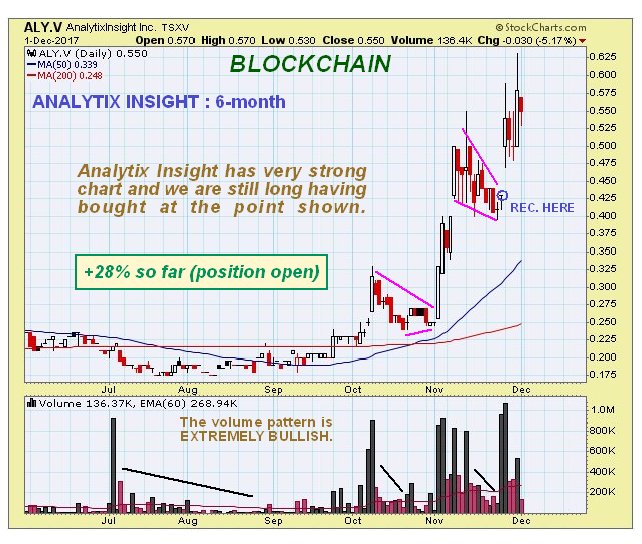
Blockchain StocksAnalytix Insight Inc ALY.V, ATIXF on OTC, C$0.55, C$0.43 Analytix has a very strong chart. We bought it about a week ago as it completed a tight bull Flag, which it then broke out of so that we are now up 28% and holding for further gains. Note the powerfully bullish volume pattern
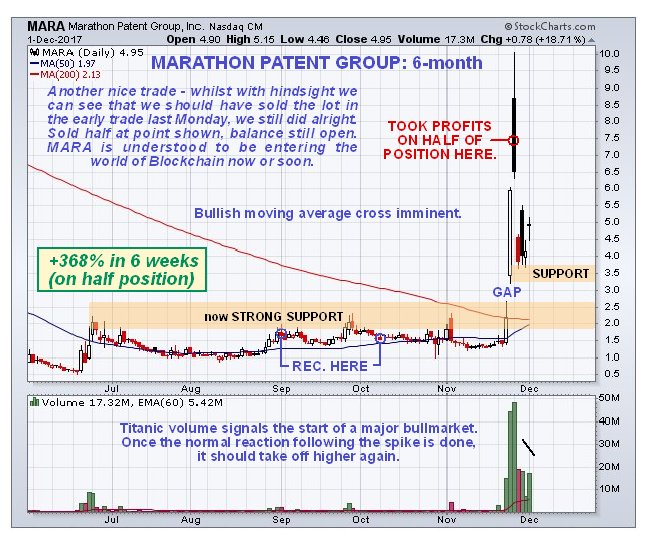
Marathon Patent MARA on NASDAQ CM, $4.95 Accumulated Marathon Patent from September through November, having observed that a Cup & Handle base was completing, accompanied by a bullish volume pattern, and that the price was converging with its falling 200-day moving average. It broke out a week or two ago and went nuts to the upside on immense volume, which was clearly a very bullish development. We sold half our position at a good price in expectation of a heavy reaction, which ensued, and held the balance for a later resumption of the advance. After we bought this stock there was a 1 for 4 reverse split, which evidently didnt do it any harm. It is understood that, despite the name, this is now a Blockchain stock.
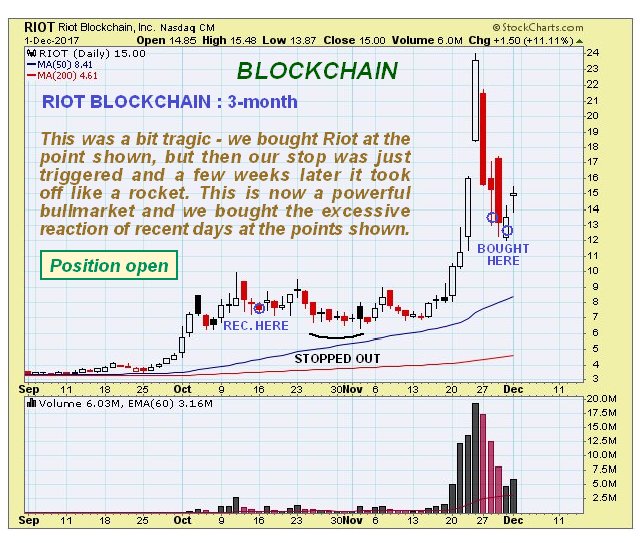
Riot Blockchain RIOT on NASDAQ CM, $15.00 We were on to Riot Blockchain as far back as October, when we bought it, but tragically we were just stopped out, because a few weeks later it broke out and took off like a rocket. Then it overreacted to the downside last week giving us a chance to jump on it at a relatively good price. Given that this stock is in one of the hottest sectors on the planet and that it is one of the few Blockchains that are publicly traded, it has the potential to do a moonshot, especially as it only has 8.32 million shares outstanding and a float of only 3.83 million.
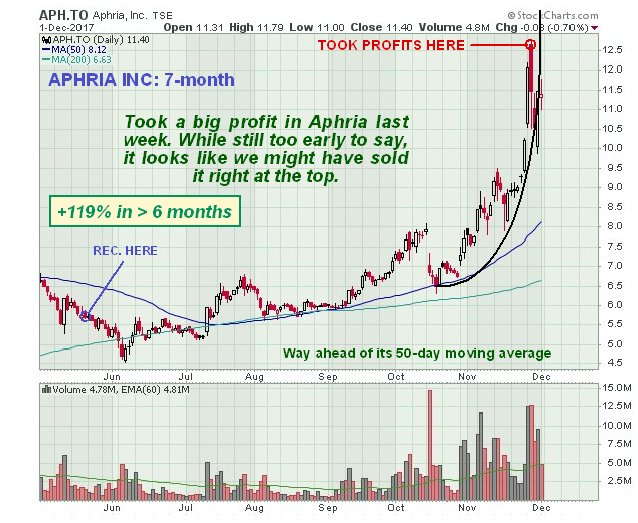
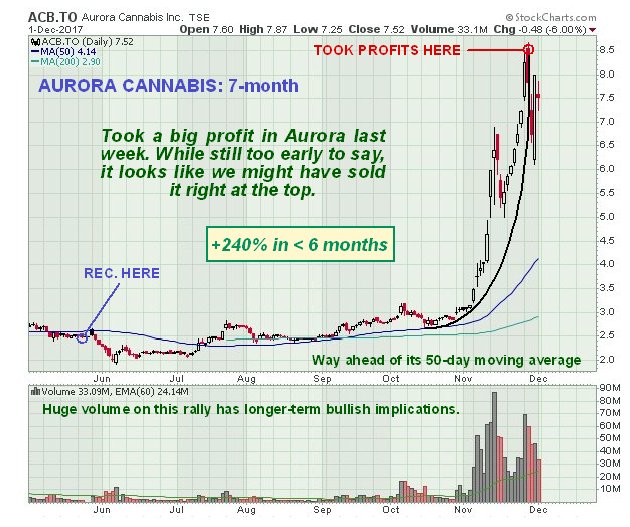
Cannabis Stocks Given the number of cannabis stocks shown below, you might be forgiven for thinking that the writer has a predisposition towards cannabis, perhaps even has an addiction problem. Not true, we went for them because they looked like they were going to appreciate, and they did. Canadian cannabis companies are the global leaders in the field, largely thanks to the moronic Federal threat to the industry south of the border, and Canada sports some of the biggest names in the industry like Aphria, Aurora Cannabis and Canopy Growth Corp, which have all done very well this year. Their growth potential (no pun intended) has not gone unnoticed by either the Alcohol and Tobacco industry or big Pharma, who are starting to circle overhead like vultures in readiness to swoop and take over these companies. This is why we went for Aphria and Aurora Cannabis over 6 months ago, which have proved to be very good investments that we sold at the peak of the recent parabolic ramp for big gains Aphria Inc APH.TSX, APHQF on OTC, C$11.40, $8.95
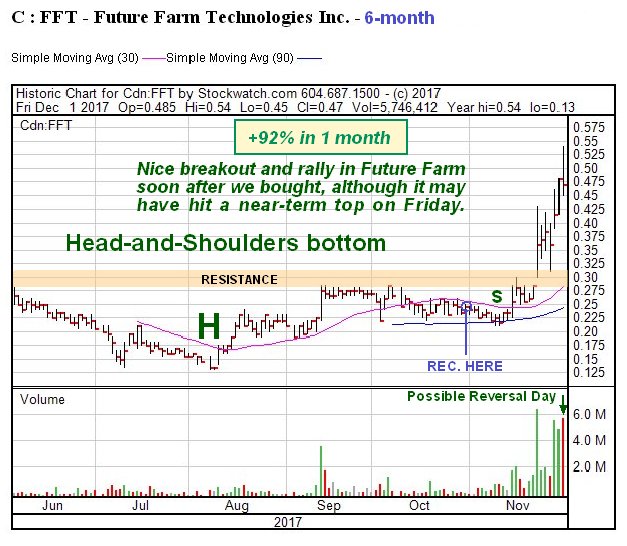
Future Farm Technologies FFT. CSX, FFRMF on OTC, C$0.47, $0.376 While Future Farm might have thought it would escape our notice tucked away out in the countryside, it didnt, because we spotted that a Head-and Shoulders bottom was completing in it, so we went for it late in October before it broke out and are up 92%. However, a toppy candle formed in it on high volume on Friday, so it may now react back
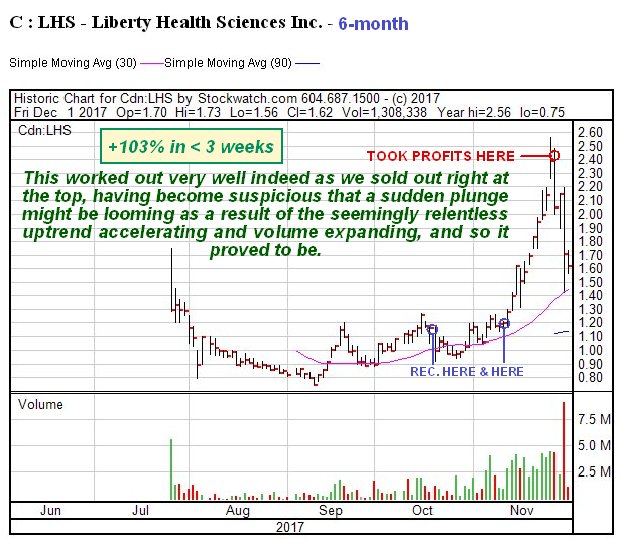
Liberty Health Sciences LHS.CSX, LHSIF on OTC, C$1.62, $1.28 It seems to be de rigueur these days for a company to massage its stock price higher before giving its shareholders a jolly good soaking with a funding exercise. We smelt a rat in the nick of time and offloaded Liberty Health for a nice profit right at the top, having grown suspicious due to an excessively orderly advance on expanding volume. This was a nice trade because it collapsed immediately after we sold it at the peak.
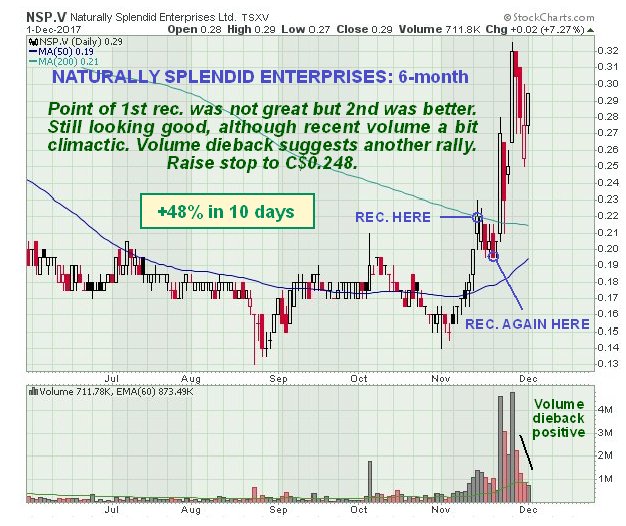
Naturally Splendid Enterprises NSP.V, NSPDF on OTC, C$0.29, $0.24 We bought Naturally Splendid at a good point, after being alerted to something going on by the 1st impulse wave which got turned back by the falling 200-day moving average. Volume pattern indicated it was going higher again, so we bought it during the formation of a tight bull Flag, and sure enough it took off higher gain, so that we are now up 48% on the last purchase in 10 days. This position is still open and we raise the stop to C$0.248 for a risk free trade.
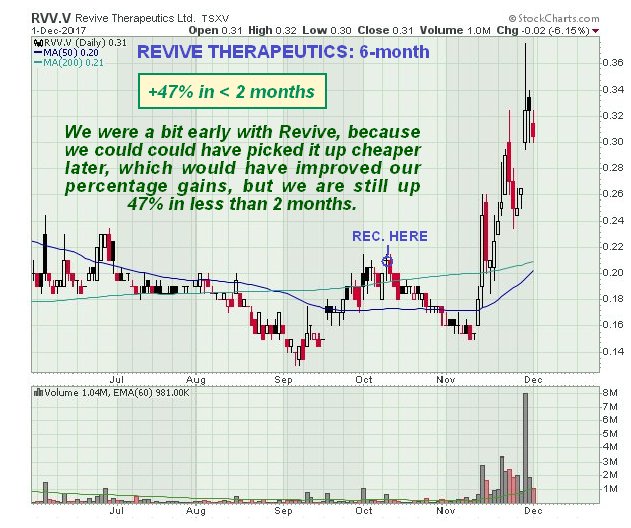
Revive Therapeutics RVV. V, RVVTF on OTC, C$0.31, $0.242 The timing of entry into this could have been better as we could have picked it up cheaper a month later, but it revived and went on to do what was expected of it with a steep advance that has resulted in us being up 47%, so its a case of alls well that ends well, except of course, that you shouldnt count your chickens until theyve hatched, as we havent sold it yet.
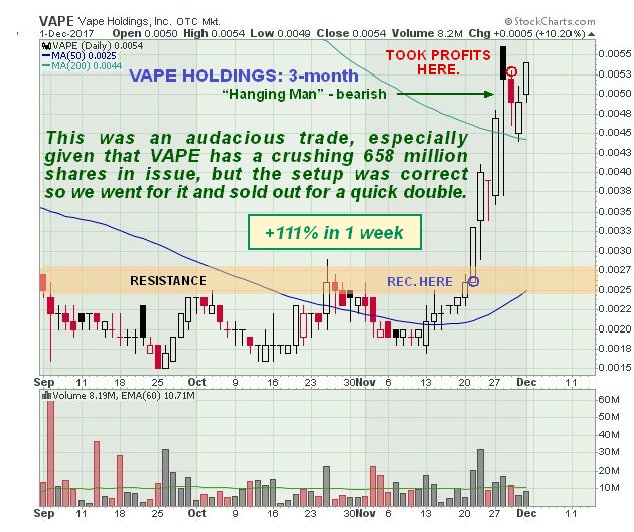
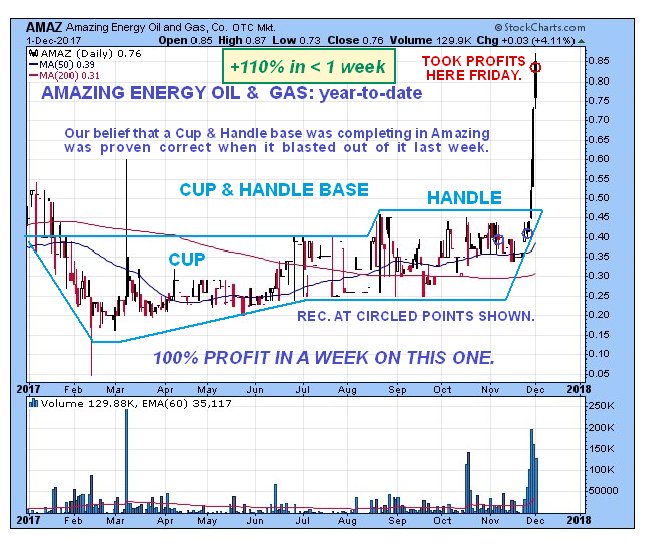
Vape Holdings VAPE on OTC, $0.0054 We worked out that Vape was ready for a sharp rally and bought it right before the rally started, and sold it last Wednesday for a quick 111% gain in less than a week. Nice work if you can get it. Be good if it reacts back so that we can perhaps give it another go.
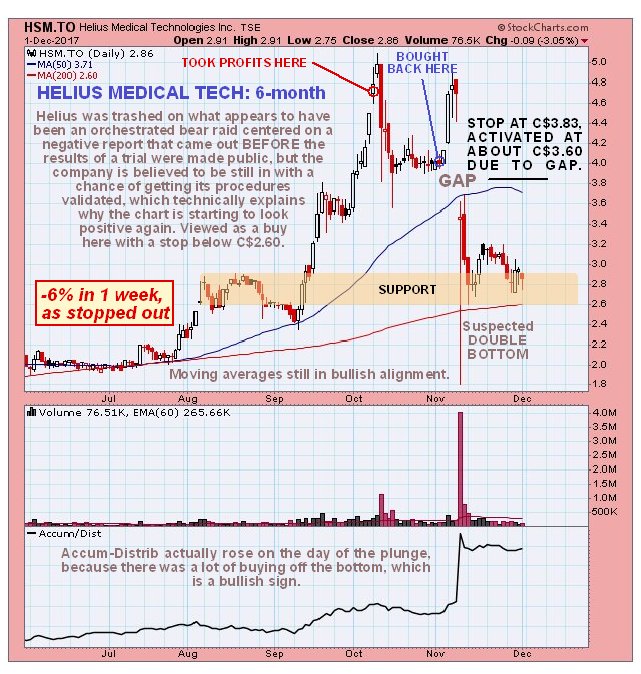
Not all of our trades are profitable of course there be always be a number of trades that dont work out as expected. This is because charts indicate probabilities not certainties, and there are always uncertainties that can throw things out of kilter, just as in everyday life. You can do the same commute for decades, but each and every day you have to be ready for the unexpected, such as a child running out in from of your car. In the same way, when trading, you have to be prepared to duck and dive and roll with the punches. For example, a charismatic well connected CEO of a company may suddenly get run over by a bus, and the next trading session the stock tanks. The only people in this game who are right all the time are liars, and in fact the only way to be right all the time is to have a time machine, like Doc and Martys DeLorean in the Back to the Future movies, which would be very useful as you could zip forward a year, take a quick peek at the charts, zoom back and make a fortune. Whilst visiting the Universal Studios lot in L.A. a few years back I came across this DeLorean, seemingly abandoned, and made them an offer for it, but they refused to sell I believe they are using it to fast forward and see which movies they are making will do well at the box office, although they would never admit it of course. Here are a couple of examples of our losing trades to balance things up Helius Medical Technologies HSM.TSX, HSDT on OTC, C$2.86, $2.23
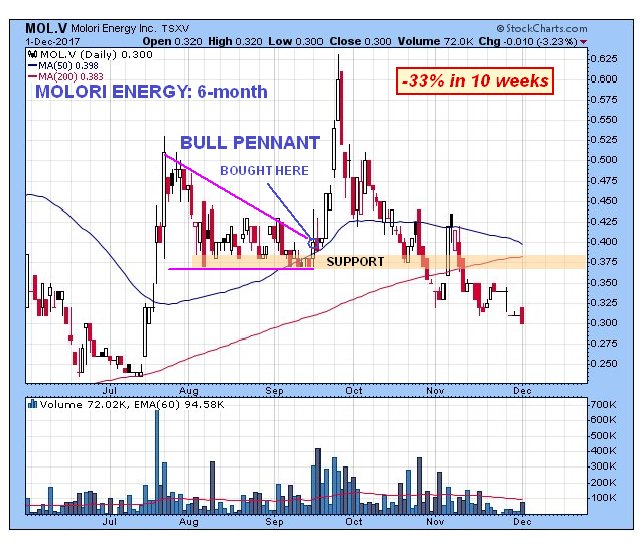
After trading Helius well for quite a while, we sold it near to the early October peak, and then bought it back at a lower price early in November. After rising again for some days it suddenly cratered, due to a brokers report that came out before the results of an important medical trial were due to be posted, resulting in instant big losses for those long the stock, and it is thought that this was an organized bear raid where those taking part hastily covered their shorts before the results came out and the price bounced back. This theory is given added credence by the fact that the Accum line actually rose on the drop. Thus there is thought to be a fair chance that a Double Bottom is forming here, especially as the price is at important support and above its rising 200-day moving average although this is a difficult setup because there is a lesser chance that the pattern is instead a bear Flag. We were saved from much bigger losses by a stop at C$3.83, which was only activated at C$3.60 due to a large gap down. Molori Energy MOL.V, MOLOF on OTC, C$0.30, $0.25
This is another stock that, after showing great promise, did an abrupt about face and ran into the sand. We bought it at the point shown, then it took off higher as expected and everything appeared to be ship shape and Bristol fashion but then it lost all its gains, didnt turn up as it should have done at support and has run off into an erosive decline, leaving us with a significant loss, but its probably too late to ditch it now as the current light volume suggests it could turn up again. Fortunately trades like this are in the minority. Stops are a way to handle such situations, although stops can be a double-edged tool as they can frequently result in you being shaken out before a big move, such as befell us with Riot Blockchain as set out above. This is especially the case with low-priced stocks.
This was an amazing trade, because after other investors had done the spade work all year building out an admittedly rather bizarre looking Cup & Handle base, we showed up like royalty at just the right time, the day before a sizable rally started, and grabbed a nice profit on Friday, because after becoming overbought at resistance, it looks like it might now react back or consolidate.
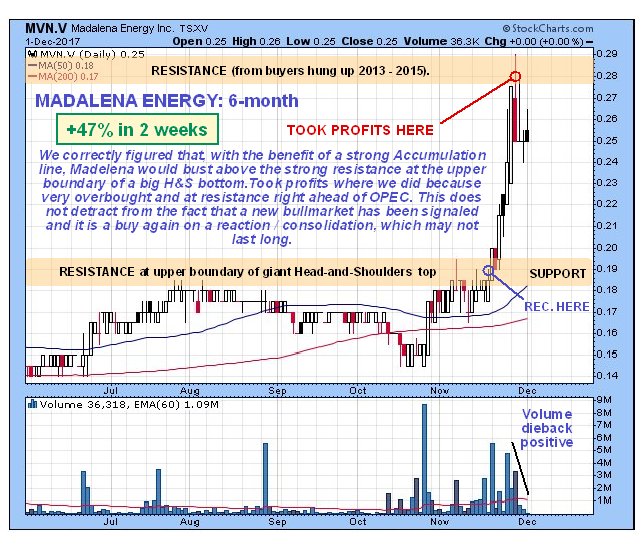
Madelena Energy MVN,V, MDLNF on OTC, C$0.25, $0.214 Here again we let other slower-witted investors do the donkey work of building out a big Head-and-Shoulders base, and then our limo rolls up to bag a quick 47% profit in 2 weeks. Thank yall be seeing ya!
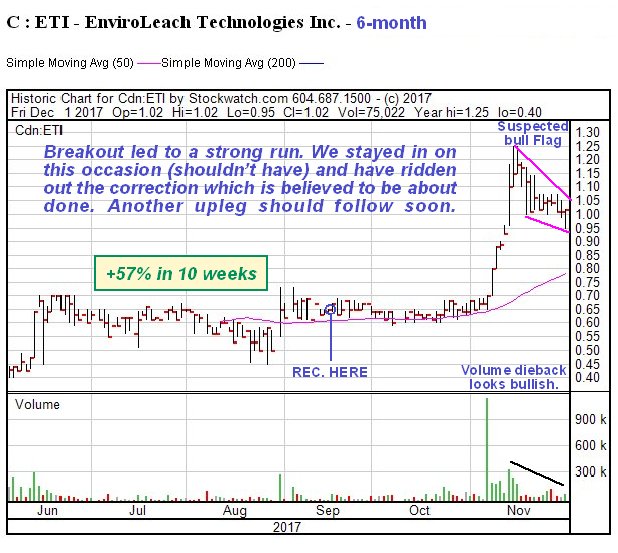
General StockEnviroleach ETI.CSX, EVLLF on OTC, C$1.02, $0.808 Theres a tremendous Urban Mining story behind both Enviroleach and Mineworx Technologies, that you are cordially invited to read here. We bought Enviroleach a little early back in September, but no regrets because early in November it broke out on big volume and rose strongly. Has reacted back on declining volume in recent weeks in what is believed to be a bull Flag. If this is what it is another upleg should begin soon.
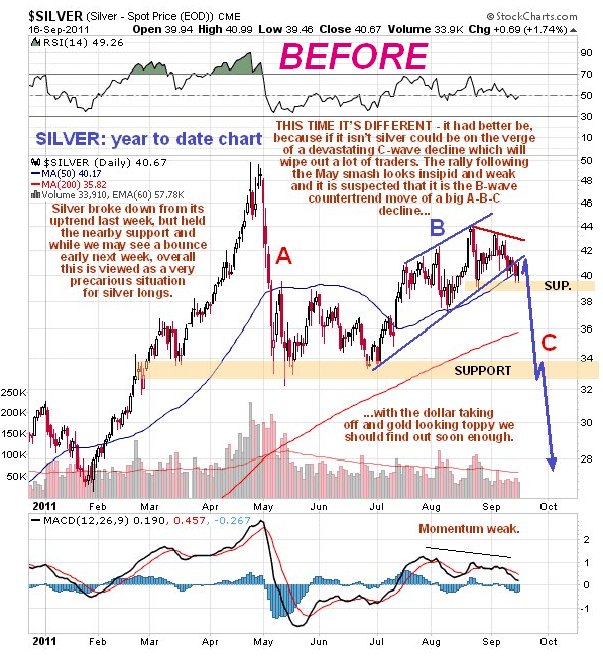
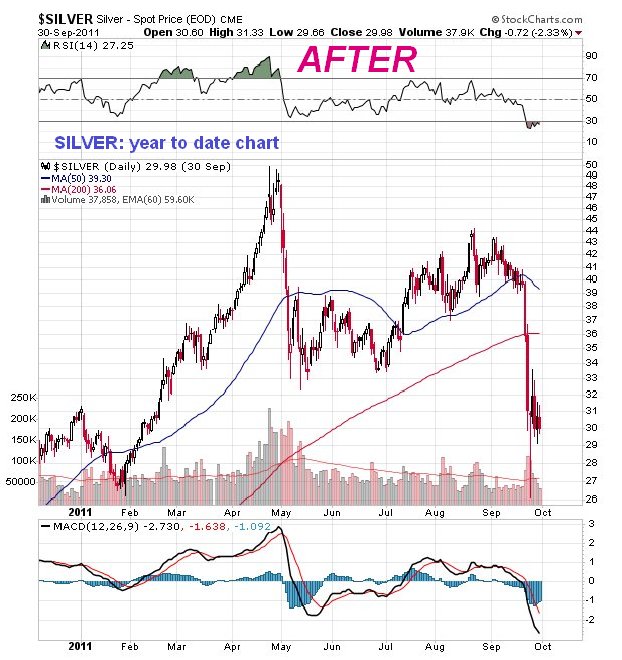
Any of you PM buffs remember this silver call made in September 2011?...
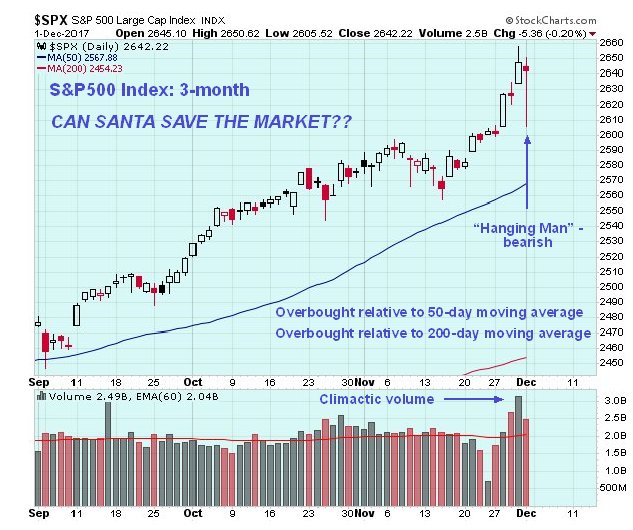
I learnt that one subscriber in California who shorted silver made enough out of this trade to buy his wife a fancy sports car, although this turned out to be a case of enlightened generosity, as guess who ended up driving it most of the time? Finally, a word about the broad US stockmarket. There was a quite dramatic drop intraday on Friday, the biggest for a long time, after which it rallied late in the day to close only a touch down on the day. This was being hailed in many quarters as a sign of its resilience, because the buy the dip crowd dutifully showed up as usual and saved the day, but thats not how it looks to us. That action Friday was a sign of growing nervousness that left behind a large bearish Hanging Man candlestick on the chart.
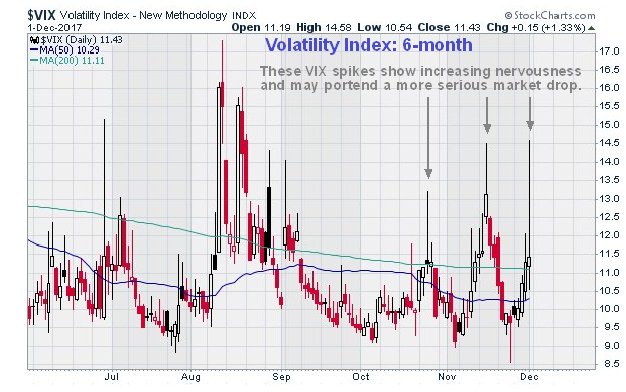
That big intraday swing also caused the third big VIX spike in as many months on Friday, also a sign of growing nervousness in the markets. While it is widely assumed that Santa will do his thing and bring good cheer to the markets as he does most years, this year he might imbibe a little too much mead or sherry and not be in a fit state to come to the markets rescue. It is therefore advised to pull in stops tighter than usual and perhaps do some Puts we will be looking at some on the site. Fundamentally this might relate to the Neocons moving closer to their objective of bringing down Trump, since the markets might drop hard in the face of the crisis that would result.
The successful use of charts as demonstrated in this review depends above all on common sense, experience and a sense of proportion, in this game formal qualifications count for nothing. In this sense at least the market is a level playing field in that it doesnt care if you are the Prince of Monaco or a taxi driver - if you get it right you win, if you dont you lose. The reason why so many highly qualified people, especially those with PHDs, fall on their faces trading markets is that they arrive on the scene with a superiority complex and the market quickly cuts them down to size.
I have done a considerable amount of work preparing this report, so now I am going to ask you to do just a little, although I understand that this may be asking a bit much of a Millennial. Get a pen and do a back of the envelope calculation, or use a tablet, and ask yourself how many of these trades you would need to pull off to cover a subscription to clivemaund.com and then how many you would have to do to have a positive impact on your life. When you have done the Math, I look forward to welcoming you as a subscriber.
The content on this site is protected
by U.S. and international copyright laws and is the property of GoldSeek.com
and/or the providers of the content under license. By "content" we mean any
information, mode of expression, or other materials and services found on GoldSeek.com.
This includes editorials, news, our writings, graphics, and any and all other
features found on the site. Please contact
us for any further information.
Live GoldSeek Visitor Map | Disclaimer
The views contained here may not represent the views of GoldSeek.com, Gold Seek LLC, its affiliates or advertisers. GoldSeek.com, Gold Seek LLC makes no representation, warranty or guarantee as to the accuracy
or completeness of the information (including news, editorials, prices, statistics,
analyses and the like) provided through its service. Any copying, reproduction
and/or redistribution of any of the documents, data, content or materials contained
on or within this website, without the express written consent of GoldSeek.com, Gold Seek LLC,
is strictly prohibited. In no event shall GoldSeek.com, Gold Seek LLC or its affiliates be
liable to any person for any decision made or action taken in reliance upon
the information provided herein.