BROAD US STOCKMARKET update - IN POSITION FOR DOWNWAVE NUMBER 2...
By: Clive Maund
-- Published: Sunday, 25 February 2018 | Print | Disqus
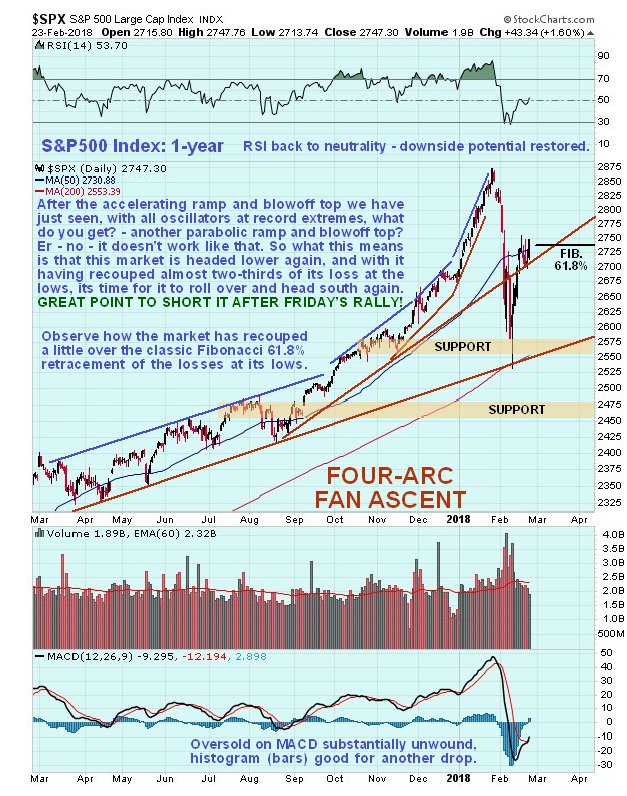
This is a very timely point to remind ourselves that when the market broke down and plunged a few weeks ago, it did so from a parabolic blowoff top, or as we had defined it, a 4-arc Fan Ascent, which amounts to the same thing for practical purposes, a top that was accompanied by all oscillators and indicators being at record overbought extremes. While this top may not look all that extreme compared to something like Bitcoin, we should keep in mind that the broad US stockmarket is infinitely greater in magnitude than something like Bitcoin, and therefore vast amounts of capital are required to create any kind of parabolic blowoff. Given that there was a long lead in to this parabolic blowoff it means that the stockmarket is done finished and the bell has been rung on a new bearmarket.
Apparently the reason that the market got a bit of a boost yesterday was that there was talk going around that the Fed realized the error of its ways, and would backtrack on QT (Quantitative Tightening) and resume QE and happy days would be here again. Theres only one problem with that argument, and its a big one, which is that if they try to resume that course in the face of gargantuan and fast rising deficits, they will crash the dollar and send rates through the roof, causing the economy to implode anyway. So, to use a rather hackneyed old expression, they are caught between a rock and hard place, they can no longer have their cake and eat it, and its payback time as all their financial crimes of extreme profligacy for years on end finally catch up with them, and unfortunately, the rest of us. Its a good time for them to start a war or wars, in addition to the ones they have started already, and blame it all on that, maybe thats what all this ludicrous Russiagate nonsense is about, they are organizing a scapegoat. Going back to QE just wont work and that means the jig is up on this bullmarket, which of course is what we would expect after a parabolic blowoff top. So how is the market looking now on the charts? You may recall that we called the top of the market within a week, and then the bottom of the plunge right after it occurred, when we closed out all Puts. A few days back we called the top for this rebound and put money on it, buying a range of leveraged inverse ETFs, but thanks to yesterdays rather sharp rally, folks may be wondering if that call is wrong is it? Lets now examine the latest 1-year chart for the S&P500 index to see how things look. The 1-year chart is very useful as it enables us to put the rebound of the past couple of weeks in the context of the 4-arc Fan Ascent into the bullmarket peak and the plunge that followed. Given that, as we have noted above, parabolic blowoff tops coming at the end of a long bullmarket are just that, tops, and are not corrections or consolidations as the government and Wall St are trying to make out, it means that this rebound is nothing more than a bearmarket rally to correct a deeply oversold condition, that should not make it back to the highs. This rebound was in order and we expected it, because the market had plunged into a still steeply rising 200-day moving average, which meant that the rebound would be sizable, and it has been. Since the top is in and a bearmarket has started, the maximum rebound to be expected was just under two-thirds of the preceding drop, or Fibonacci 61.8% to be precise, which is why we shorted it by buying bear ETFs last week when it recouped this percentage, since which time the market has risen marginally above this target level as can be seen on the chart, but interestingly yesterdays rally did not succeed on closing above the intraday high of the previous Friday. Thus the market should turn lower here or very soon and we are believed to be at a great point to short it.
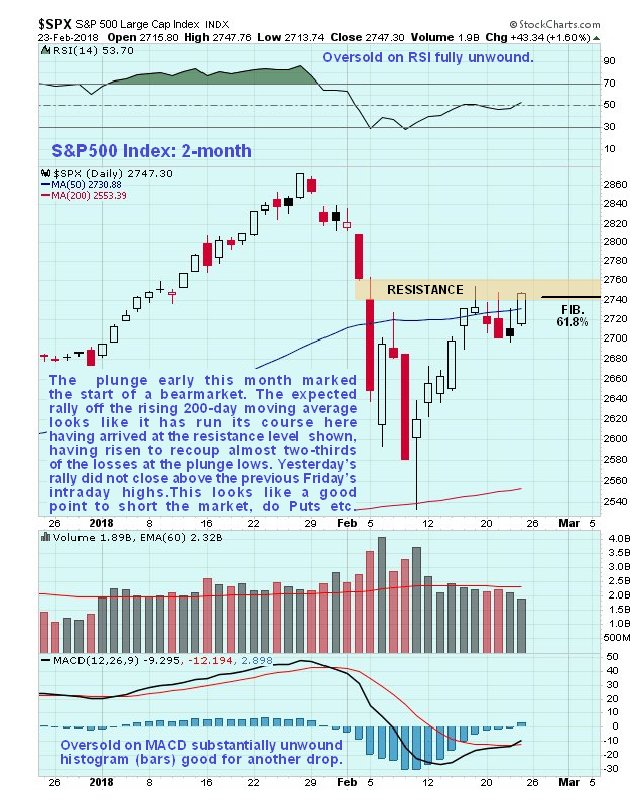
The 2-month chart shows recent action in much more detail. On it we can see how at the bottom of the plunge the S&P500 index bounced almost exactly off its rising 200-day moving average, making a large bullish hammerlike candlestick. Having reached our target for the bounce the market started to run into trouble this past week and some bearish looking candlesticks appeared, but then on Friday it put in a better performance closing with a larger white candle, but as mentioned above this did not break above the previous Fridays intraday high, nor did it break above the resistance level shown which put a lid on the advance all week, but whether it does or doesnt short-term, this is now regarded as a VERY bearish setup, with renewed decline expected imminently whose 1st objective will be to retest the plunge lows.
Conclusion: the rally of the past couple of weeks is not a resumption of the bullmarket, as the government and Wall St would have you believe (we just had a normal 10% correction) it is a countertrend relief rally within a bearmarket that promises to be severe, and it is believed to have run its course. This means that we are at a perfect or near perfect point to short the market for a downleg that could easily be worse than the 1st one, an ideal time to load up on Bear ETFs and Puts, which is what we did last week.
The content on this site is protected
by U.S. and international copyright laws and is the property of GoldSeek.com
and/or the providers of the content under license. By "content" we mean any
information, mode of expression, or other materials and services found on GoldSeek.com.
This includes editorials, news, our writings, graphics, and any and all other
features found on the site. Please contact
us for any further information.
Live GoldSeek Visitor Map | Disclaimer
The views contained here may not represent the views of GoldSeek.com, Gold Seek LLC, its affiliates or advertisers. GoldSeek.com, Gold Seek LLC makes no representation, warranty or guarantee as to the accuracy
or completeness of the information (including news, editorials, prices, statistics,
analyses and the like) provided through its service. Any copying, reproduction
and/or redistribution of any of the documents, data, content or materials contained
on or within this website, without the express written consent of GoldSeek.com, Gold Seek LLC,
is strictly prohibited. In no event shall GoldSeek.com, Gold Seek LLC or its affiliates be
liable to any person for any decision made or action taken in reliance upon
the information provided herein.