Gold Market Update - COTs, sentiment super bullish as Fed set to reverse course...
By: Clive Maund
-- Published: Monday, 27 August 2018 | Print | Disqus
We are now seeing an overwhelming body of evidence coming together to suggest that gold and silver have hit bottom, and that even if they haven't, the bottom is very close and downside risk is very limited. On a more mundane level, the drop in gold and silver prices the recent past is pushing many mines to the brink of becoming economic at a time of an impending supply crunch, a situation that must soon lead to higher prices. Whilst we were premature in calling a bottom earlier this year, it really does look like the time has come to "back up the truck" for reasons that we will now set out as briefly and succinctly as possible.
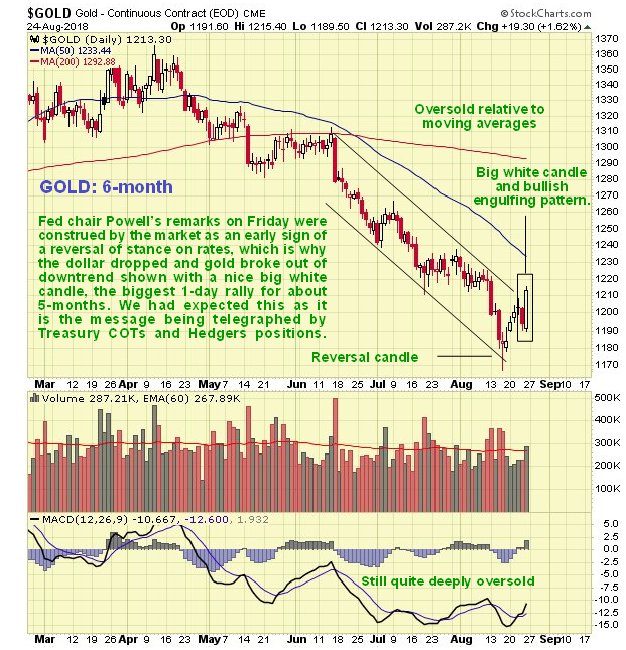
Starting with gold's 6-month chart, we see that on Friday it had its biggest up day for about 5-months, with a large white candle and "bullish engulfing pattern" which has made an approximate Double Bottom with the lows of about a week ago, with this occurring at a time when it is deeply oversold, as made clear by the low reading of its MACD indicator and the large gap with its moving averages.
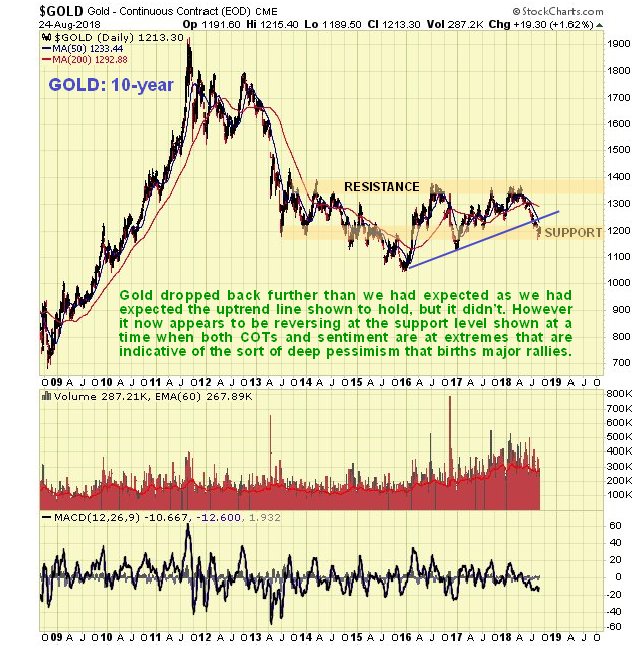
Whilst gold has dropped back further than we would like to see on its 10-year chart, and further than we had earlier expected, it is noteworthy and important that it has not dropped below the support at its 2013 lows, which means that this is a good point for it to turn up.
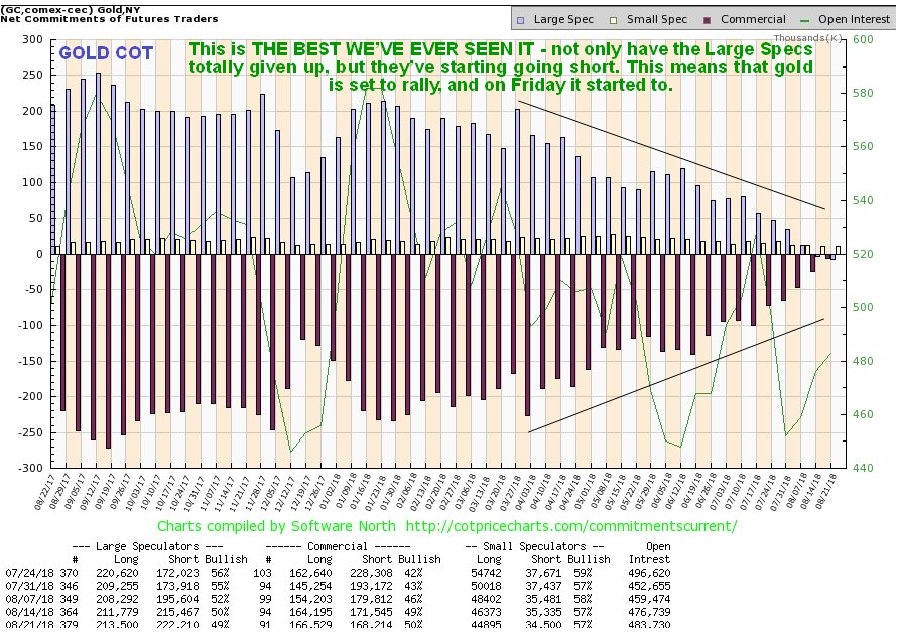
The chances of gold turning up here are hugely enhanced by its latest COT and sentiment data. Its latest COT chart shows that the Large Specs have now abandoned all long positions and actually started going short for the 1st time in our memory and for the 1st time since gold's big bullmarket started in 2000 - 2001. This is viewed as exceptionally bullish because the Large Specs are overall always wrong.
Click on chart to popup a larger, clearer version.
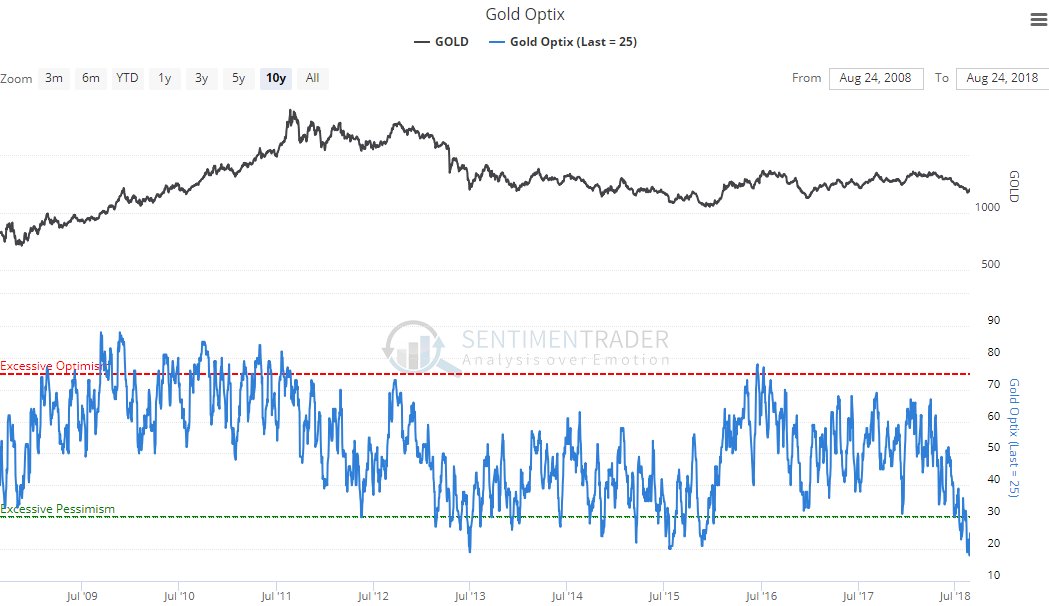
Moving on, we see that the Gold Optix, or optimism chart, is plumbing abysmally low levels, which is of course another sign that gold is probably at a bottom, because the great mass of investors are always negative and despondent at major market bottoms.
Click on chart to popup a larger, clearer version. Chart courtesy of sentimentrader.com
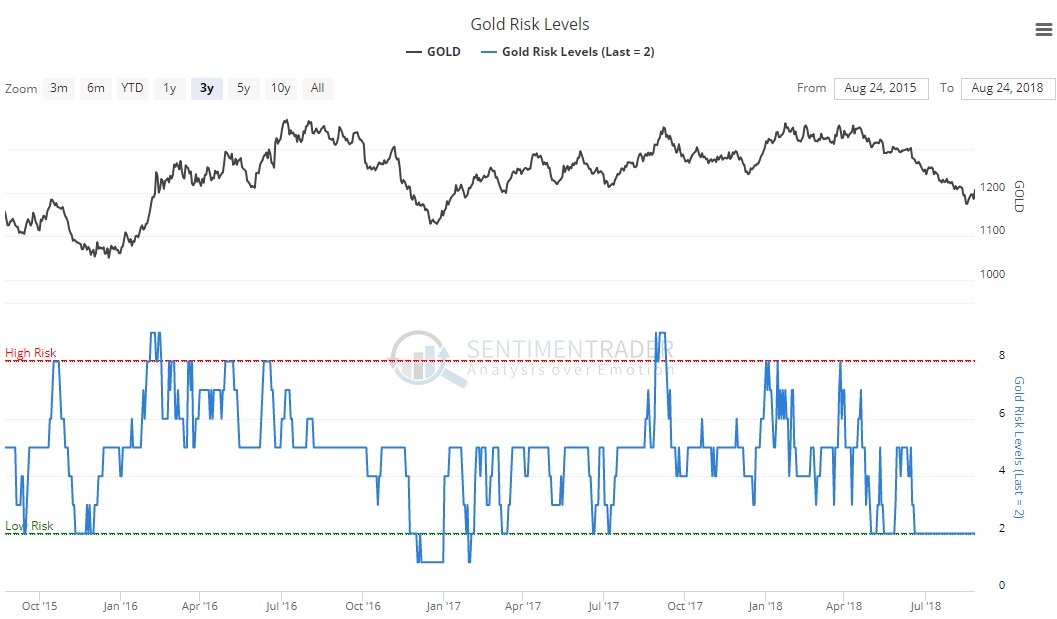
Joining the "gloom and doom" party we have the Gold Risk Levels chart, which is showing a reading of 2, that is close to the lowest it has ever got, which is 1.
Click on chart to popup a larger, clearer version. Chart courtesy of sentimentrader.com
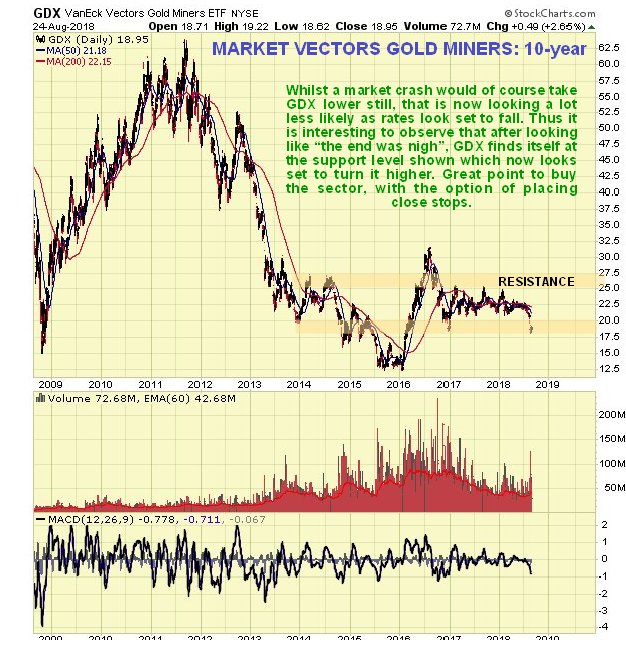
Gold stocks took a beating in recent weeks and whilst shorter-term charts have looked really scary, the big picture shown on our 10-year chart for GDX looks nowhere near as disturbing. Although the drop of recent weeks was not of course what bulls wanted to see, it has not quite broken GDX below the important support level shown, and the chances of it reversing to the upside here are vastly improved by the current abyssmal sentiment towards the sector.
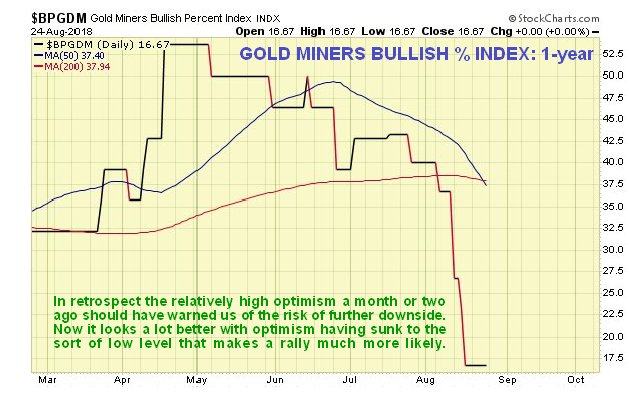
In retrospect we should have been able to tell from the Gold Miners Bullish % Index chart some weeks back that there was scope for further losses, but now, after the latest sector drop, it is looking a lot healthier, with the now very low level of bullishness making a rally a lot more likely...
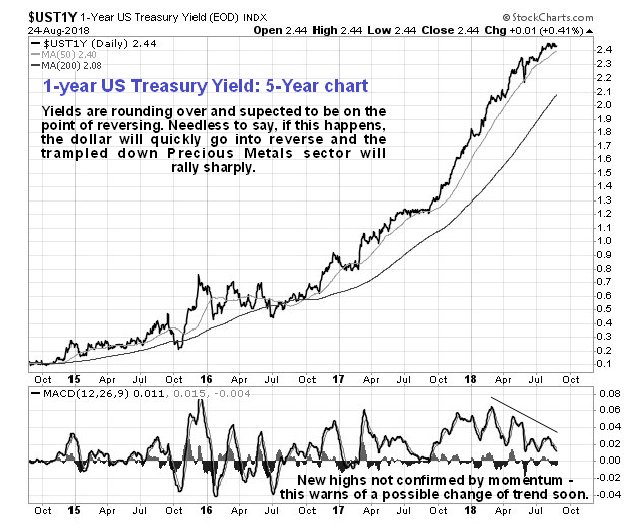
Having figured out from all these charts that gold has probably hit bottom and is about ready to turn up, what might the fundamental reason for this be? Well, of course, the strongest reason would be if the dollar were to stop advancing and reverse to the downside, so how likely is that? - very likely as it happens, for as we had deduced several days back, the Treasury market is getting ready for a surprise big rally which means that rates in the US are set to drop, and falling rates will quickly kick out the props from under the dollar. The notion of a surprise Treasury rally is by no means wishful thinking - it is based on powerful technical evidence that has been building for many weeks - evidence which points to the Fed making a U-turn on rates, which it undoubtedly is coming under heavy pressure from The White House to do. Let's look at this evidence again now. We start with the 5-year chart for the 1-year Treasury Note yield, which shows that the earlier vigorous advance in rates is now running out of steam, as evidenced by the MACD momentum indicator that has not been confirming recent new highs.
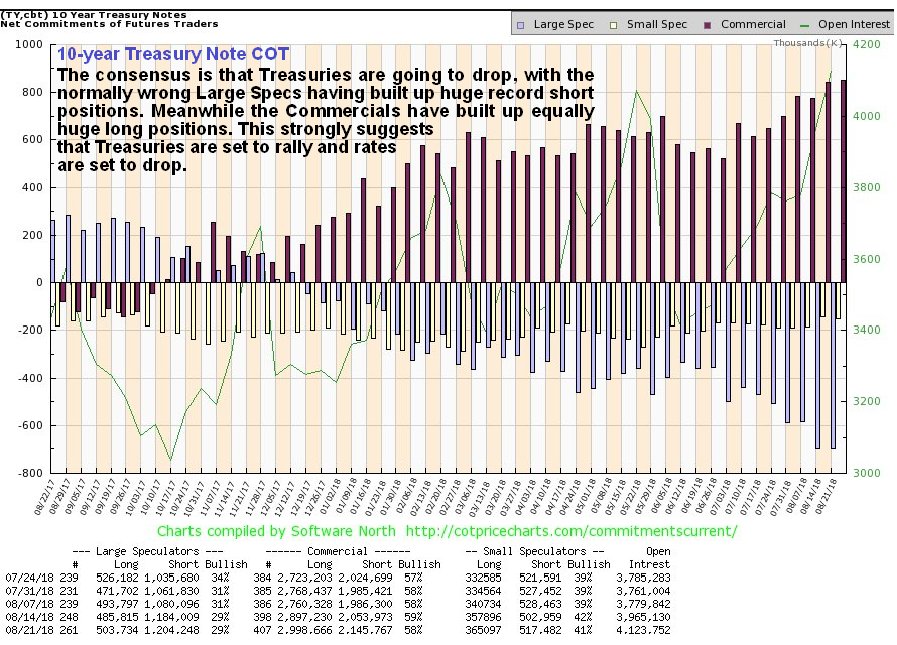
Next we see on the latest COT chart for the 10-year Treasury Note that normally wrong Large Specs have bought the hype and are now running record short positions by a country mile - they look set to get fleeced, and you don't need to be a genius to figure out who will walk off with the pie, as they always do - the Commercials - who have built up record long positions - perhaps they have some important friends at the Fed, as well as in the media.
Click on chart to popup a larger, clearer version.
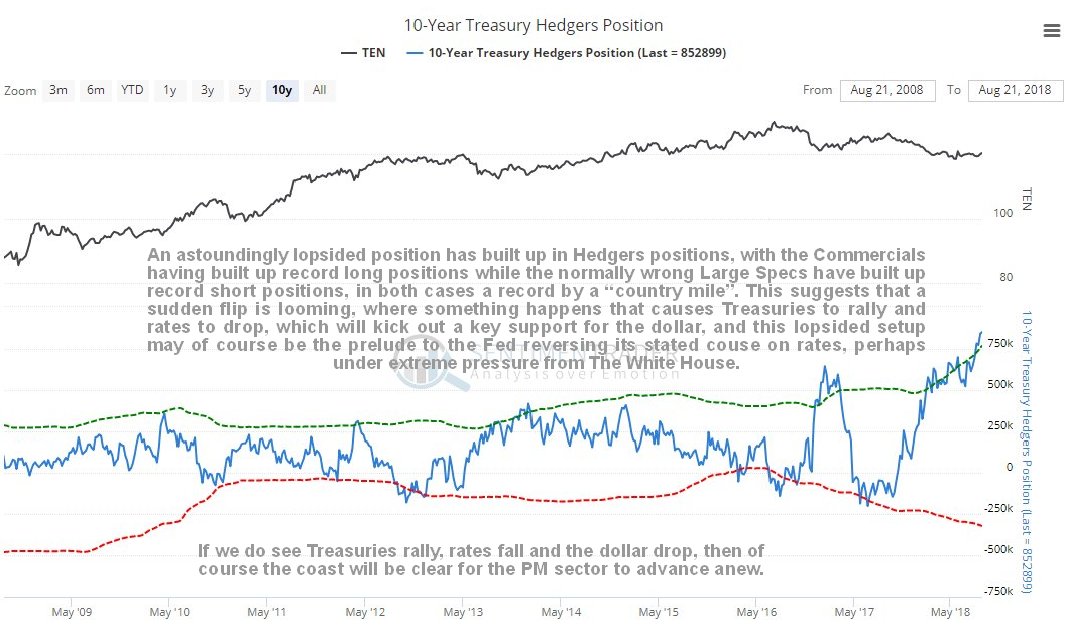
The latest Hedgers chart also for the 10-year Treasury Note is equally if not more astounding. It shows that Smart Money Commercial Hedgers have built up record net long positions in these Treasuries. What all this means is that a thundering great rally is probably building in Treasuries, that will knock rates back down and rip the rug from under the dollar.
Click on chart to popup a larger, clearer version. Chart courtesy of sentimentrader.com
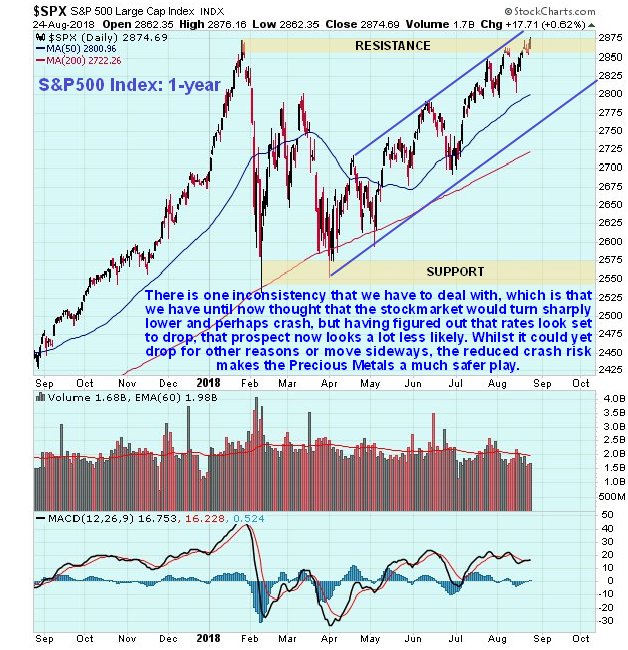
Finally, there is one major inconsistency which we need to address. One of our biggest fears in the recent past and a deterrent to being more aggressively bullish the PM sector has been the lurking risk of a market crash. However, as we had started to figure out last week, a big Treasury rally is a growing probability, and that means a sizeable drop in rates, which will take the wind out of the dollar's sails and fuel a big recovery rally in gold and silver. In addition, a significant drop in rates will greatly lower the risk of a market crash in the foreseeable future. Although the stockmarket could drop for other reasons it is less likely to be so severe that it negatively impacts gold and silver which will be rising due a falling dollar. Instead, we may even see modest new highs in the stockmarket, but more likely is that it runs off sideways or enters a mild downtrend.
The conclusion is that it is time to back up the truck with the PM sector - assuming you still have a truck to back up, that is.
The content on this site is protected
by U.S. and international copyright laws and is the property of GoldSeek.com
and/or the providers of the content under license. By "content" we mean any
information, mode of expression, or other materials and services found on GoldSeek.com.
This includes editorials, news, our writings, graphics, and any and all other
features found on the site. Please contact
us for any further information.
Live GoldSeek Visitor Map | Disclaimer
The views contained here may not represent the views of GoldSeek.com, Gold Seek LLC, its affiliates or advertisers. GoldSeek.com, Gold Seek LLC makes no representation, warranty or guarantee as to the accuracy
or completeness of the information (including news, editorials, prices, statistics,
analyses and the like) provided through its service. Any copying, reproduction
and/or redistribution of any of the documents, data, content or materials contained
on or within this website, without the express written consent of GoldSeek.com, Gold Seek LLC,
is strictly prohibited. In no event shall GoldSeek.com, Gold Seek LLC or its affiliates be
liable to any person for any decision made or action taken in reliance upon
the information provided herein.