-- Published: Monday, 5 November 2018 | Print | Disqus
The Precious Metals sector continues to be viewed with disdain and skepticism by the vast majority of investors, which is exactly what you want and expect to see at the earliest stages of a major bullmarket. However, the charts continue to shape up well, as we will now see.
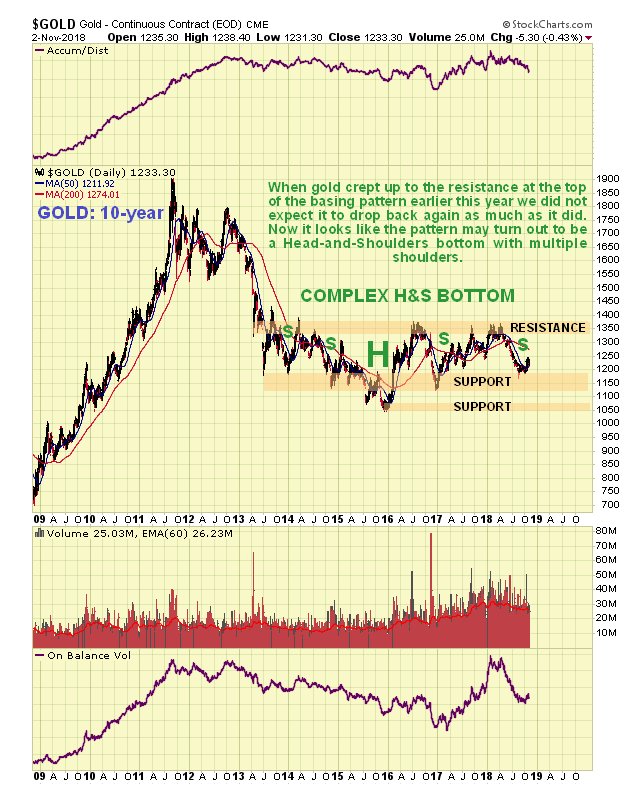
Starting with the long-term 10-year chart for gold, we see that it is approaching completion of a more or less symmetrical complex Head-and-Shoulders bottom, with multiple shoulders. It is now believed to be rising up to complete the final Right Shoulder, that should be followed by a breakout above the resistance at the top of the pattern, which will be a positive technical development of huge significance.
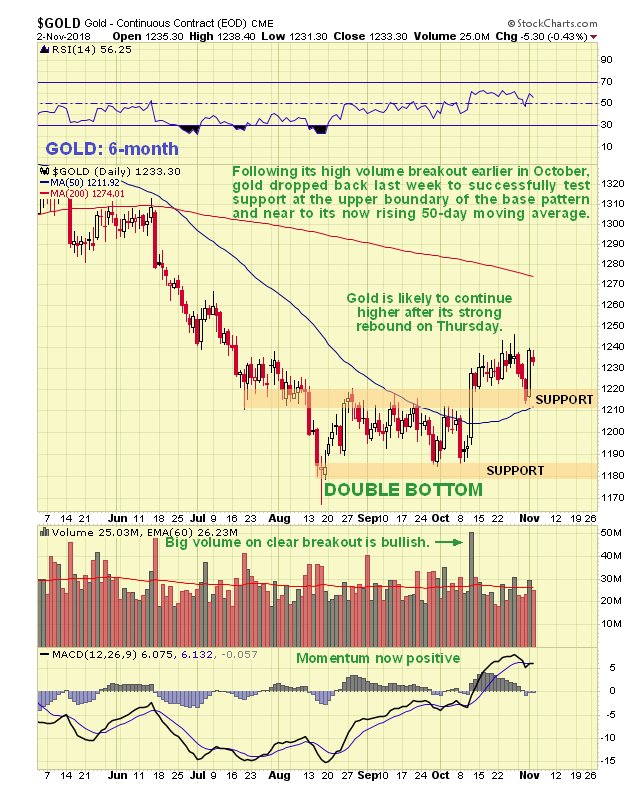
On the 6-month chart we can see consistently positive technical action in the recent past, as gold made a clear breakout from a Double Bottom with a fine large white candle on very heavy volume on 11th October, a sign that it means business. It is thus not surprising that the test of support at the top of this base pattern a few days ago was successful, amply demonstrated by another big white candle as it decisively reversed to the upside again on Thursday.
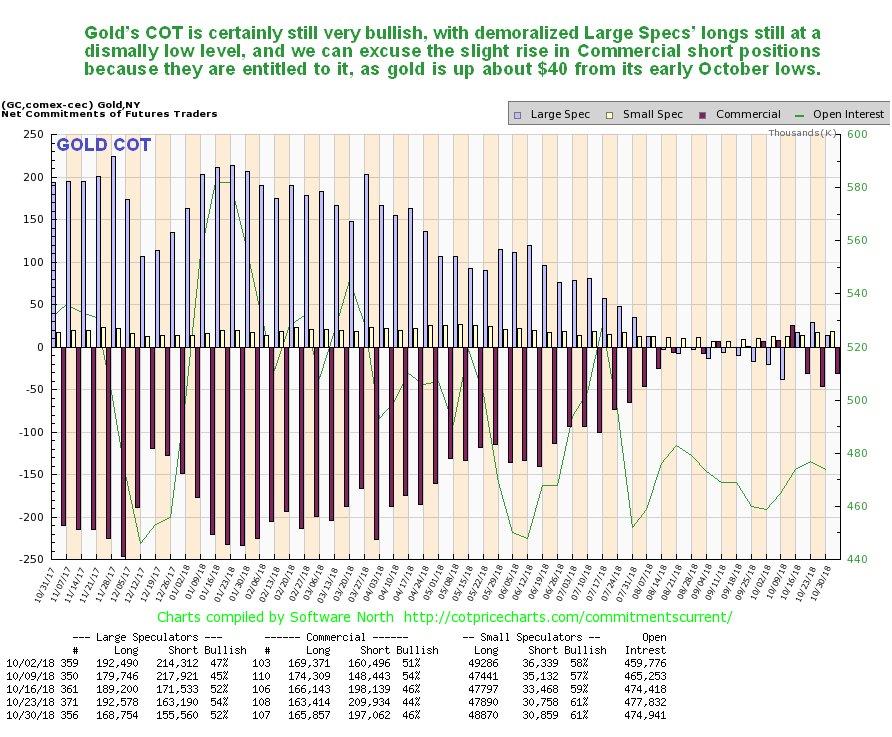
Golds latest COT remains very bullish, with Large Specs having virtually no enthusiasm for gold at all. Note that the slight buildup in the Commercials short positions over recent weeks is justified, given that gold is up significantly from its early October lows, and the main point to note is that this chart shows that there is plenty of room for a big rally by gold before COT positions become extreme.
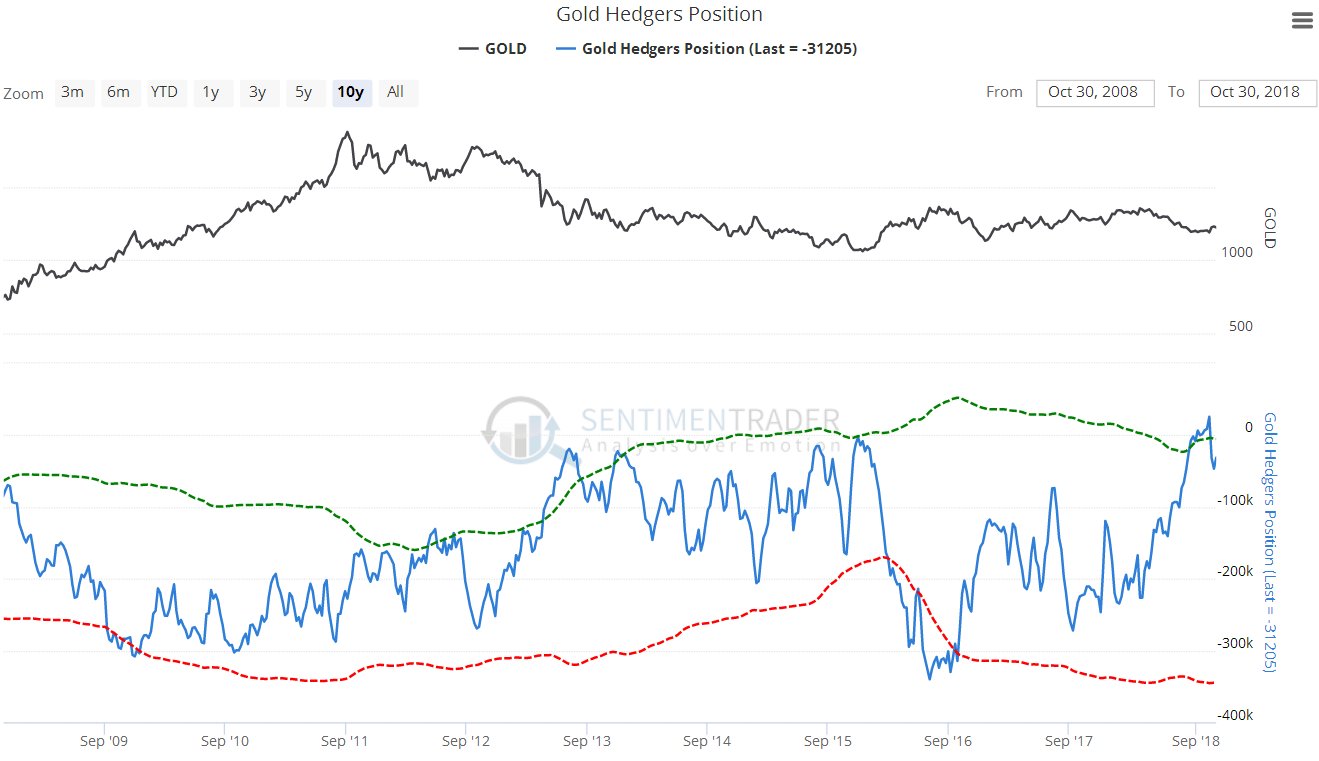
Click on chart to pop up a larger, clearer version. Gold Hedgers positions are still very positive for gold overall, despite easing back from their extreme of early October
Click on chart to popup a larger, clearer version. Chart courtesy of sentimentrader.com
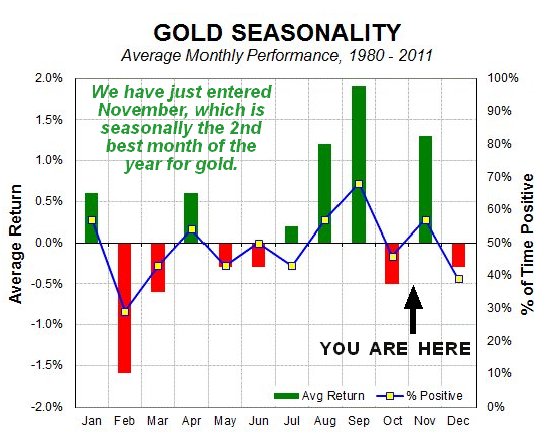
Although gold did alright last month, October is on average a rather poor month for gold, on the basis of seasonal factors, as we can see on its seasonal chart below. However, November, which we have just entered, is much better and is actually the 2nd best month of the year for gold, seasonally, and although a background factor, its a help
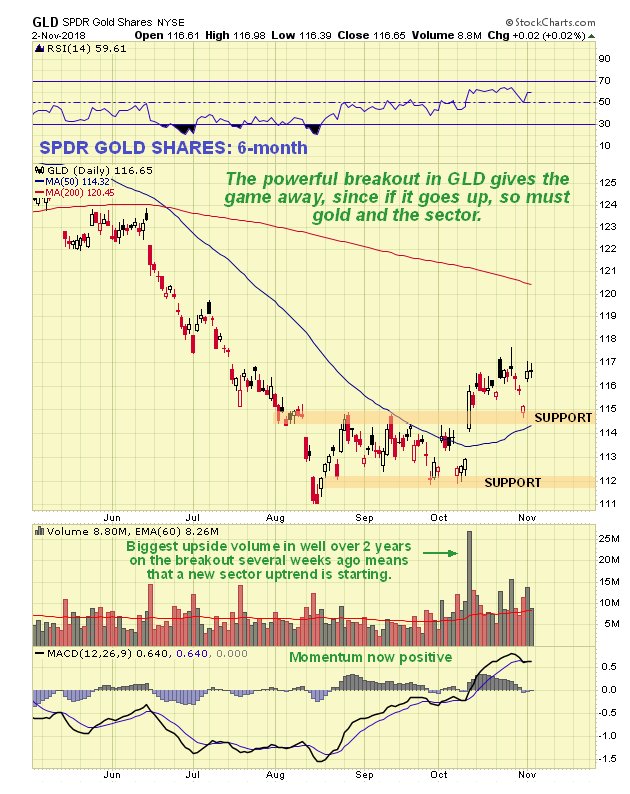
Chart courtesy of sentimentrader.com The chart for gold proxy SPDR Gold Shares in even more bullish than the chart for gold itself, as it sports a powerful high volume breakout from its base pattern several weeks back. We also saw a successful test of support by GLD last Wednesday.
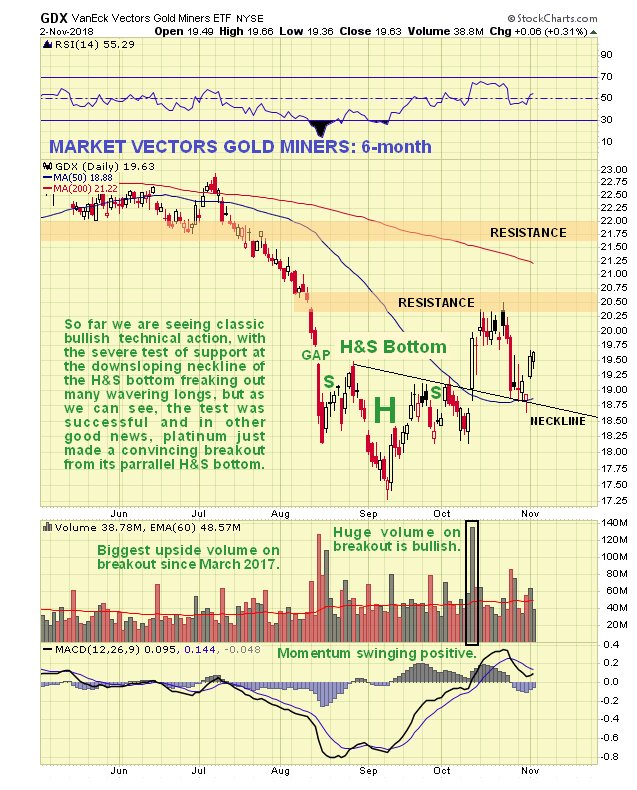
Gold stocks indices also present a very bullish picture. On the chart for GDX, which is an accurate PM stocks proxy, we can see the big down day about 10 days ago which freaked out many more nervous investors in the sector, yet this was just a test of support at the neckline of the Head-and-Shoulders bottom pattern, which we had anticipated, although it was a bit of a nail biter on the day it dropped through the neckline, only to bounce back to close above it by the end of the day. Action late last week was positive with it rising away from the neckline again. There was a convincing breakout from the H&S bottom earlier in October, with a big up day on the highest upside volume since March 2017. With respect to the larger picture GDX has quite a bit of work to do to turn it really positive, which will involve it rising sufficiently to take the 50-day moving average up through the 200-day, that is still quite some way above, and working its way through the considerable resistance between approximately 21 and 24.
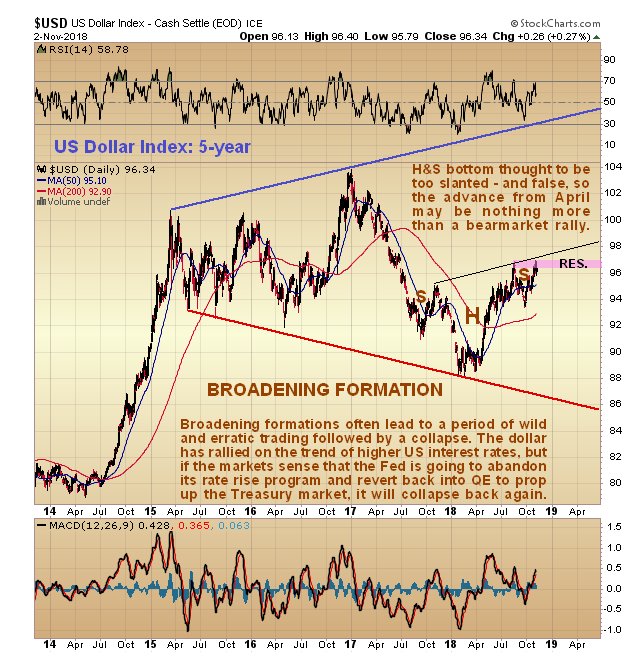
What about the bearish arguments going around that the PM sector will get taken down again by another deflationary bust, as in 2008. Lets consider these. First of all, deflation isnt necessarily bad for gold. it certainly wasnt during the deflationary bust of the 30s when the PM sector went countertrend and did very well indeed. Secondly, the PM sector is already beaten down severely and extremely undervalued going into this bust, which it wasnt before the 2008 market crash back in 2008 had a lot of room to fall, now it doesnt. Thirdly, it is widely assumed that the dollar will continue to surge in the event of a broad based deflation of asset bubbles, as in 2008, but will it? Back in 2008, funk money went into the dollar, partly in order to seek safe haven in Treasuries, but so far during the current bust just starting it isnt why not? The argument of the dollar bulls and gold bears is that the bust will cause a dollar short squeeze and a surge of dollars coming home, but heres another argument. Why didnt investors scurry into Treasuries as the stockmarket tanked in recent weeks? In the first place, unless you are spending other peoples money which is often the case, you have to be mad or stupid to buy the government paper of a State that is technically bankrupt. The so called booming economy in the US right now was financed by tax cuts, and since that means a shortfall in revenue for the government, the difference has been made up by growing the deficit. Thats alright when you can count on foreign mugs to keep conducting trade in US dollars and recycling those dollars into Treasuries, thus enabling the US to live the high life as it has since the 2nd World War by swapping piles of intrinsically worthless paper (dollars and Treasuries) for goods and services nice work if you can get it. However, theres an old saying which goes Dont bite the hand that feeds you and the US has in the recent past not just been biting the hand, but chewing the whole arm off. Many foreigners are indeed corrupt, stupid and gullible just look at those idiots in Europe allowing NATO wargames right on Russias doorstep its like they learnt nothing from WW2, but if you kick them in the teeth hard enough even they start to question their loyalty. US foreign policy since the 2nd World War has basically operated along the following lines with the blunt message to the rest of the world You stick with using the dollar in international trade, because if you dont, well destroy your economy with sanctions (and now tariffs), and if that doesnt work well send our military over to give you a bloody good hiding. In the case of Europe all they had to do of course was centralize the economy via the European Union, and then buy off the leaders with huge bribes, and the masses there seem to be starting to comprehend that their leaders are not there to serve their best interests, especially in Greece which they have impoverished and asset stripped. The problem now for the US is that there are seismic shifts underway in the global economic landscape, and rising powers have become fed up with the US telling them what they can and cannot do, and employing strongarm tactics to enforce compliance. They know that the key to ridding themselves of this dominance is to wriggle out of using the dollar in international trade and to stop supporting the US Treasury market, which is the giant aorta that funnels the rest of the worlds treasure into US coffers. This is why they have been accumulating gold on a massive scale in recent years, so that they will have the power to back their currencies with it at a time of their choosing in the future, and beefing up their militaries at a rapid rate in order to deter the military aggression that their ditching the dollar will invite, with the theaters for eventual war with China already demarcated as the South China Sea and Taiwan. Now that the massive global debt bubble is starting to implode, things are beginning to get really ugly and the gloves are coming off, as the US becomes more overt in its efforts to destroy the economies of China and Russia which threaten its hegemony and other countries it doesnt like, such as Iran. Evidently, most of the US Neocons havent read the classic How to Win Friends and Influence People and instead are antagonizing and provoking many other world powers to the point that they are now working assiduously to end the dollar as the Reserve Currency and thus choke off the source of US power, and it would seem they are making great strides in this direction. As David Rosenberg (@EconguyRosie) of Glusdkin Sheff recently opined in a Tweet Dont tell anyone that foreign buying of Treasury debt has been cut in half this year and keep it a secret that the foreign share of world FX reserves has shrunk to a 5-year low of 62.5%. The USD role as the reserve currency is on its last legs. So, if foreigners are dramatically scaling back their buying of Treasury debt, which is essentially worthless garbage as it is the paper of a bankrupt nation, then who does that leave to buy the stuff? why, the Fed of course. So at some point, and probably sooner rather than later, they are going to have to reverse position, halt the interest rate rises and revert to QE on a larger scale than ever before in order to head off a potentially devastating run on Treasuries by making good the shortfall in demand themselves. Right now their rate rises and QT are causing the stockmarket to buckle and cave in, a process which will worsen until they reverse course, and if a stockmarket crash fails to drive up the Treasury market, as looks likely, they are in big trouble. The point of setting all this out is that if the Fed reverses course into lowering rates and doing large scale QE again in order to prop up the Treasury market, as it looks like it will be forced to do sooner than expected, then the dollar will go into a tailspin, which is made more likely by it already being at a high level, and this will cause the vaunted Head-and-Shoulders bottom in the dollar highlighted in some quarters to abort, and if that happens the Precious Metals sector will of course soar. The supposed Head-and-Shoulders bottom in the dollar is shown on our 5-year dollar index chart below, and is regarded with deep suspicion for several reasons, one of which is that the neckline of the pattern is steeply upsloping, which makes it more likely that it is false, and another big reason is that the giant Broadening Formation that we can see dating back to early 2015 is bearish in purport, and what often happens is that a rally of the kind we have seen since April gets back to about halfway up the pattern before it fizzles and fails and the sharp drop in the dollar on Thursday, which caused the PM sector to break higher again, looks like a reversal.
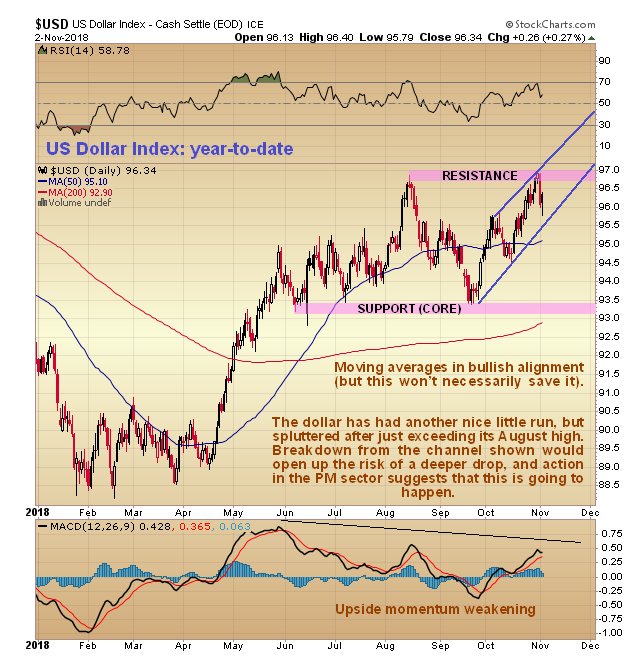
The year-to-date chart for the dollar index is interesting as it shows the sizable runup from April through late May and how this has been followed by a slightly upsloping trading range. Widely thought of in some quarters as the Right Shoulder of a Head-and-Shoulders bottom, this range may instead mark the high point of a bearmarket rally. The latest runup from late September stalled out and reversed last week just above the August high. Whilst the channel shown is unbroken, the dollar could still break out to another new high, but we should look out for a breakdown from this channel, suggested as likely by the action in the PM sector, which would usher in a deeper drop.
So all in all, the outlook for the PM sector looks very positive indeed, with almost all of the potential gains in the sector ahead of us. In the parallel Silver Market update we also look at the latest charts for copper and platinum, which are showing solidarity with the PM sector, especially platinum, which broke out from a fine Head-and-Shoulders bottom just last week.
The content on this site is protected
by U.S. and international copyright laws and is the property of GoldSeek.com
and/or the providers of the content under license. By "content" we mean any
information, mode of expression, or other materials and services found on GoldSeek.com.
This includes editorials, news, our writings, graphics, and any and all other
features found on the site. Please contact
us for any further information.
Live GoldSeek Visitor Map | Disclaimer
The views contained here may not represent the views of GoldSeek.com, Gold Seek LLC, its affiliates or advertisers. GoldSeek.com, Gold Seek LLC makes no representation, warranty or guarantee as to the accuracy
or completeness of the information (including news, editorials, prices, statistics,
analyses and the like) provided through its service. Any copying, reproduction
and/or redistribution of any of the documents, data, content or materials contained
on or within this website, without the express written consent of GoldSeek.com, Gold Seek LLC,
is strictly prohibited. In no event shall GoldSeek.com, Gold Seek LLC or its affiliates be
liable to any person for any decision made or action taken in reliance upon
the information provided herein.