The SUPER BLOOD WOLF MOON ECLIPSE and the Markets...
By: Clive Maund
-- Published: Monday, 21 January 2019 | Print | Disqus
Having watched Van Helsing I thought "There must be a way to work this stuff into chart analysis" and there is, for tomorrow night there is a "Super Blood Wolf Moon Eclipse" which might synchronize with a reversal in the markets. Before you burst out laughing, I point out that it is an established fact that reversals in the Precious Metals often synchronize with full and new moons, and whether this is a matter of astrology or simple gravitational pull or a combination of these factors is an open question.
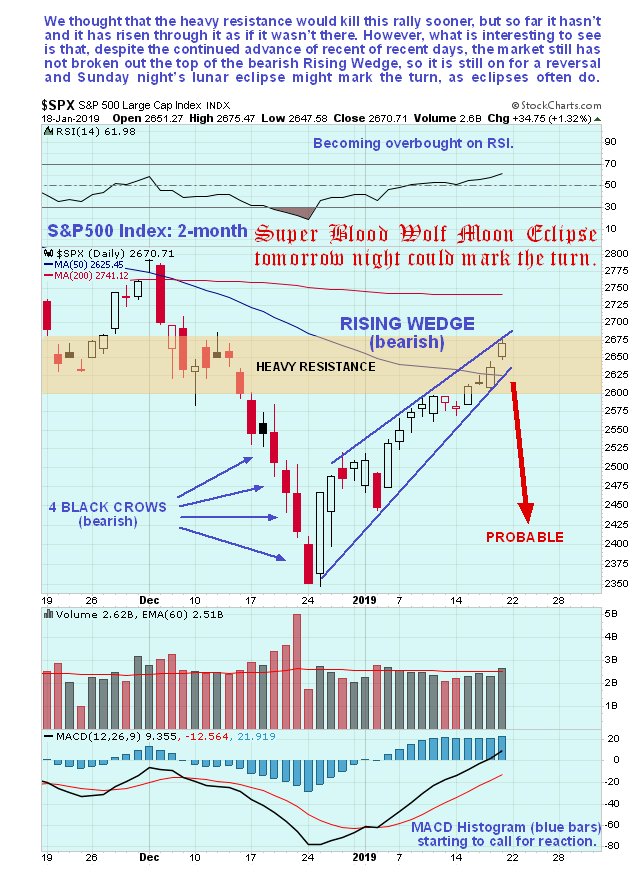
As you will be aware we had expected the rally in the broad US stockmarkets to be snuffed out by heavy resistance some days back, but it wasn't and the market has continued to advance, as we can see on the latest 2-month chart for the S&P500 index shown below. However, a very important point to observe is that it has not broken out upside from the bearish Rising Wedge, and remains within its confines, and this Wedge continues to portend a reversal and sharp drop soon. We were in error defining the lower boundary of this Wedge and thought it had broken down from it, but it hadn't, not quite, and the uptrend picked up steam again and it made another run at the top of channel, arriving at its upper boundary on Friday, which obviously pressured our short positions. Now though, with the Wedge closing up and the market deep into heavy resistance, the chances of a near-term reversal are considered to be higher than ever.
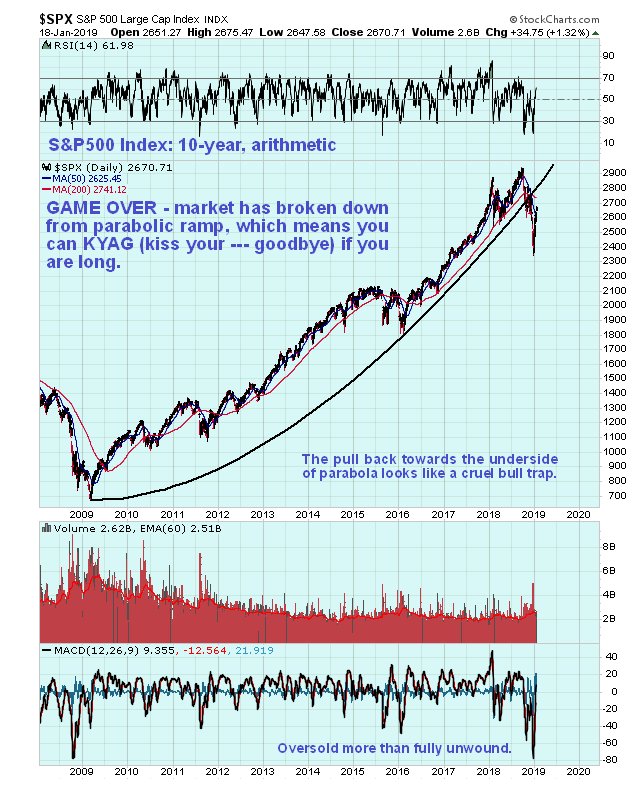
In this update we will take the opportunity to briefly consider the market from other perspectives. For example on the 10-year arithmetic chart for the S&P500 index we can see that the drop late last year broke the market down from a parabolic blowoff top and thus the short-covering rally of recent weeks back towards the underside of the parabola looks like a cruel bull trap...
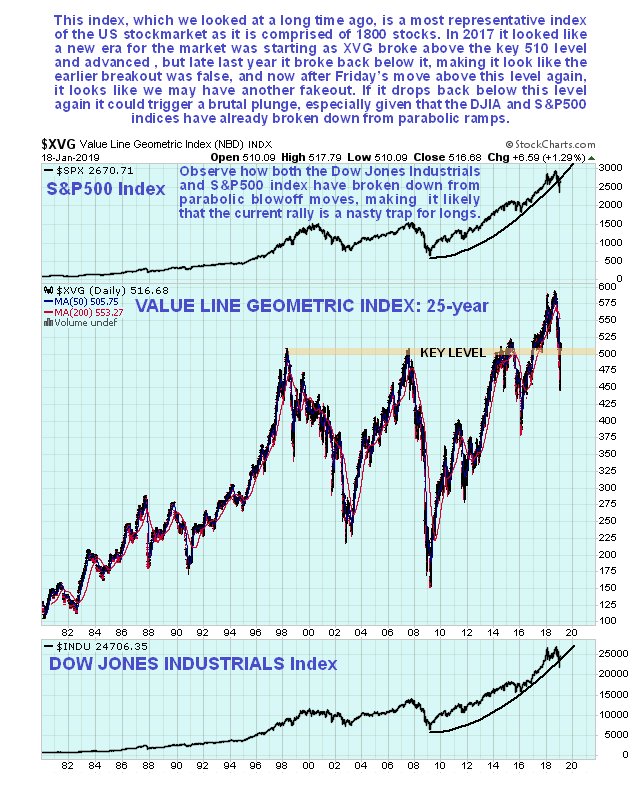
Another chart well worth examining is that of the Value Line Geometric Index, which is the most accurate representation of the entire US stockmarket as it comprised of 1800 unweighted stocks. Its long-term 25-year chart reveals the importance of the 510 level on this index, which capped major advances on 3 occasions, in 1998, 2007 and 2014 - 2015. It only really got clear above this resistance in 2017 and that appears to have been a false breakout as it dropped back below 510 late last year, but on Friday it popped back above this level again. However, given what we are seeing elseehere this break above this level looks like another false dawn for the market, and if it drops back below 510 again it could plunge.
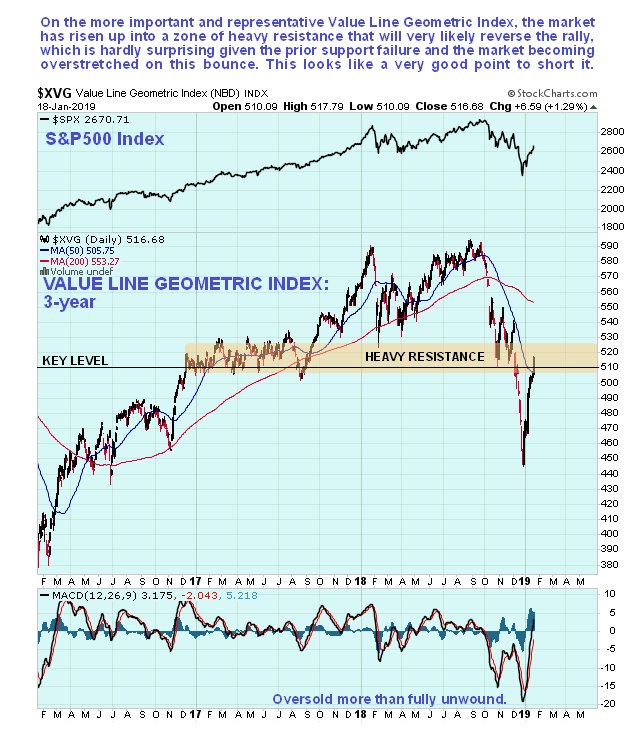
The 3-year chart for the Value Line Geometric Index shows that the index poking its nose above 510 has brought it up into a zone of heavy resistance arising from choppy trading in a range late in 2016 and during the 1st 8 months of 2017 which, given how sharply it has risen over the past several weeks through a falling 50-day moving average, makes it very vulnerable to a reversal and drop here, especially as the 200-day is now falling, which together with the major support failure has opened up the risk of a deepening bearmarket.
Will the Super Blood Wolf Moon Eclipse tomorrow night mark the turn? - it very well could, and if it does it will leave the newly bullish howling. What does the term "Super Blood Wolf Moon Eclipse" mean? - super refers to the moon being close to the closest point to the Earth in its monthly cycle at the eclipse, blood is because during totality the moon turns red-orange in color, Wolf moon refers to a January full moon. So let's see what happens. Certainly the combination of the technical factors that we have looked at here and esoteric ones in play tomorrow night strongly suggests that the market will reverse early next week - whatever happens just be sure to keep some garlic handy. End of update. Posted at 8.35 pm EST on 19th January 19.
Postscript
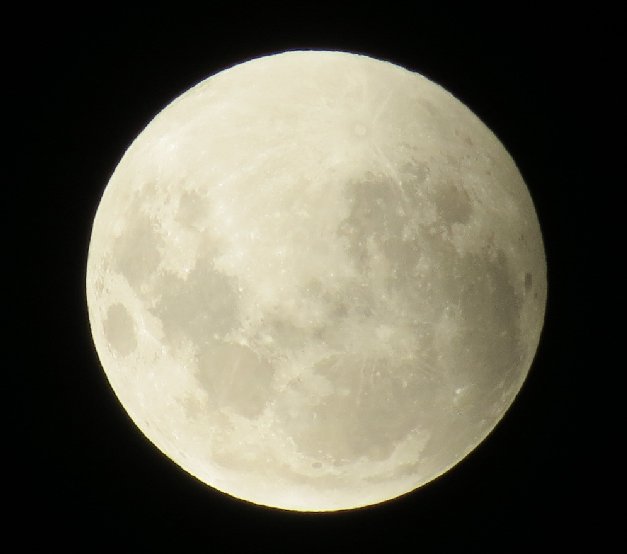
The eclipse was visible at Maund Acres in southern Chile, and for the benefit of those of you with an interest in celestial phenomena, a selection of photos that I took of the eclipse are shown below. Note that there are none of the moon later emerging from the shadow because I went to bed. The moon enters the penumbra, or partial shadow
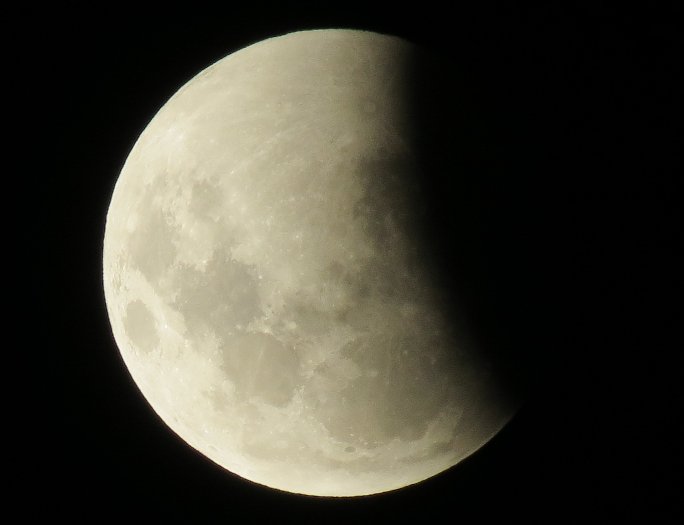
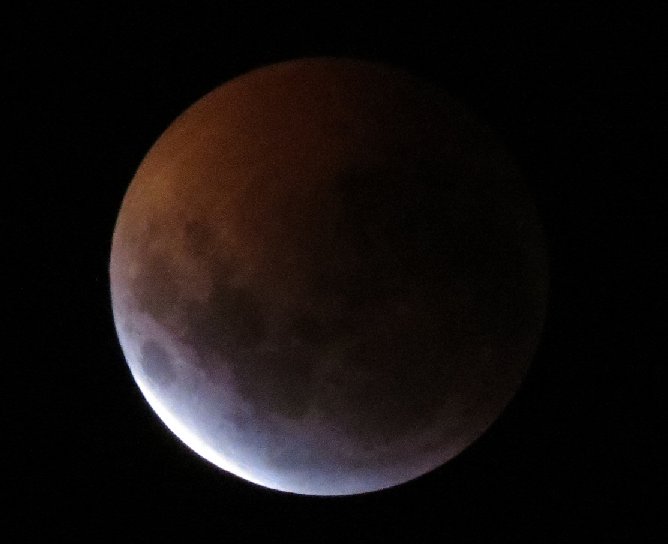
The moon entering the umbra or zone of total shadow. On this photo we can see the large ray crater, Tycho, towards the top, about to be plunged into total darkness, total that is apart from the pale orange light refracted from the Earths atmosphere onto the lunar surface
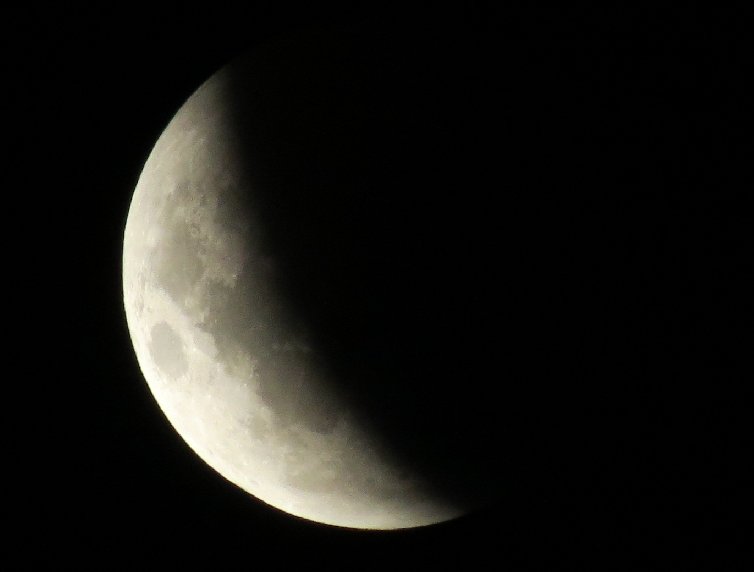
The moon being swallowed up by the Earths shadow. Because the Earths shadow at this distance is considerably larger than the moons diameter, this does not look like a normal crescent moon
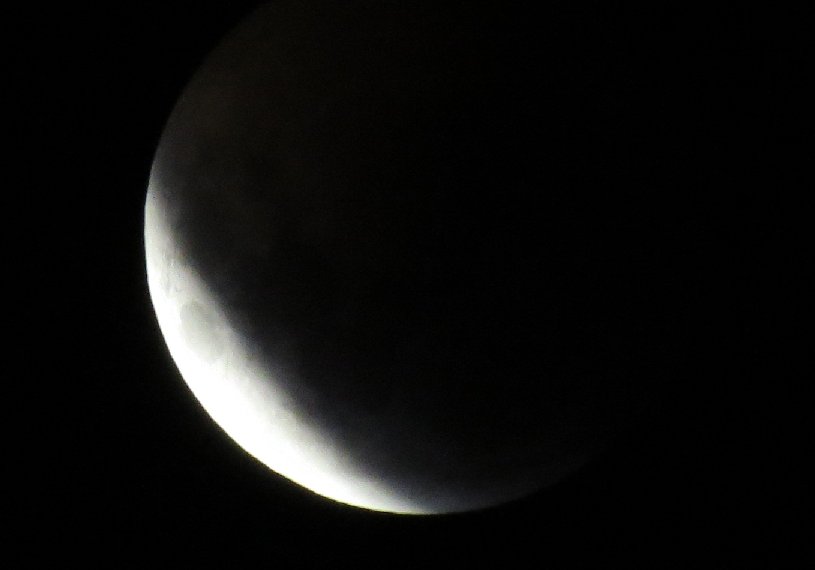
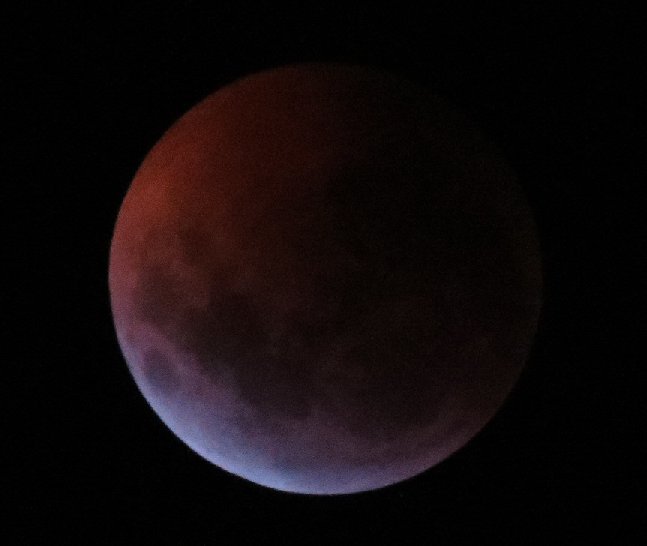
Not much left the circular Mare Crisium can be seen in this photo
Going, going
Gone with the sun totally eclipsed by the Earth, the lunar surface receives a faint red light refracted around through the Earths atmosphere
All photos by Maund, Maund Acres, Villarrica, Chile.
The content on this site is protected
by U.S. and international copyright laws and is the property of GoldSeek.com
and/or the providers of the content under license. By "content" we mean any
information, mode of expression, or other materials and services found on GoldSeek.com.
This includes editorials, news, our writings, graphics, and any and all other
features found on the site. Please contact
us for any further information.
Live GoldSeek Visitor Map | Disclaimer
The views contained here may not represent the views of GoldSeek.com, Gold Seek LLC, its affiliates or advertisers. GoldSeek.com, Gold Seek LLC makes no representation, warranty or guarantee as to the accuracy
or completeness of the information (including news, editorials, prices, statistics,
analyses and the like) provided through its service. Any copying, reproduction
and/or redistribution of any of the documents, data, content or materials contained
on or within this website, without the express written consent of GoldSeek.com, Gold Seek LLC,
is strictly prohibited. In no event shall GoldSeek.com, Gold Seek LLC or its affiliates be
liable to any person for any decision made or action taken in reliance upon
the information provided herein.