-- Published: Monday, 18 February 2019 | Print | Disqus
By: Clive Maund
Gold has been turned back so many times in recent years from the strong resistance approaching the $1400 level, that most investors have now been well trained, like Pavlovs dog, to expect it like clockwork, and as we know, it is just when this mindset prevails that gold is likely to surprise the majority by actually breaking out above this level.
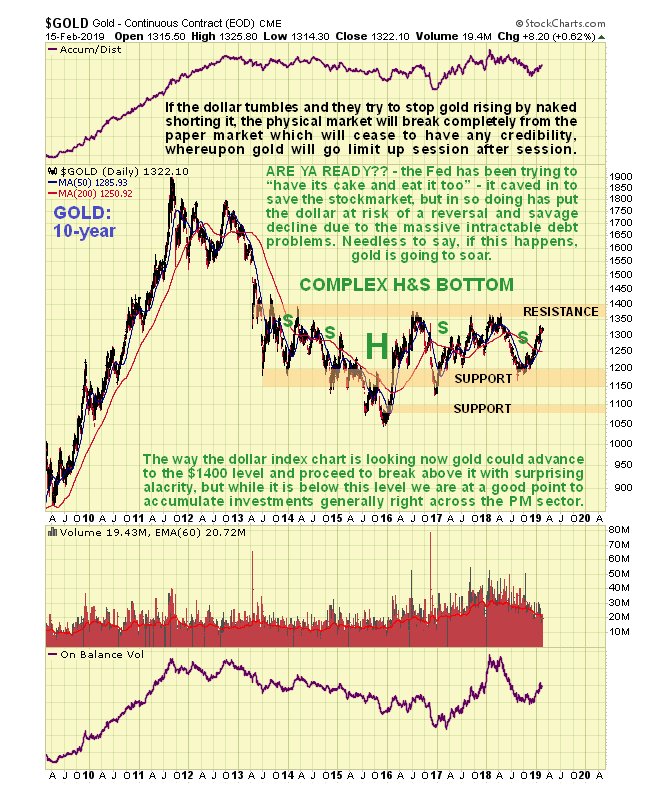
Looking at our latest 10-year chart for gold its not hard to see why most investors are defeatist about golds chances of breaking out. After all it has made 5 more serious attempts to break above this level since mid-2013 and all have failed. Even if they see what we see on this chart, which is gold approaching completion of a giant complex Head-and-Shoulders bottom, they are still skeptical. They will mutter something about The Cartel and their power to clobber gold at will by manufacturing an infinite supply of paper shorts, which they then dump on the market when most of us are asleep isnt it supposed to be 300 to 1 leverage now, or is it 3000 to 1? Ive lost track. Their dastardly objective, we are told, is to maintain confidence in the fiat money system for as long as possible, because they can point to golds feeble performance and say Look, if its so bad, why isnt gold going through the roof? This negative outlook towards gold is of course promoted by the MSM (mainstream media), one of whose Prime Directives is to keep the average investor on the wrong side of the trade.
One big factor that has kept a lid on gold in recent years is the continued strength of the dollar, but with respect to this there has been a major development this year, which is the Fed caving in and starting to flip flop in order to stop the stockmarket crashing. However, the Fed cant have its cake and eat it too it has to decide what it prefers a stockmarket driven higher by endless QE that leads to hyperinflation against the background of a collapsing dollar in the face of mammoth debts, or a high(er) interest rate policy to prop up the dollar that implodes the stockmarkets leading to a depression some choice. Their backpedaling last month to goose the markets has kicked a major prop out from under the dollar, which threatens to tip into a severe decline, and each time the Fed flip flops verbally to try to save first the stockmarket and then the dollar it will lose credibility, until it ends up with none, and amongst more intelligent people it hasnt got very much to start with.
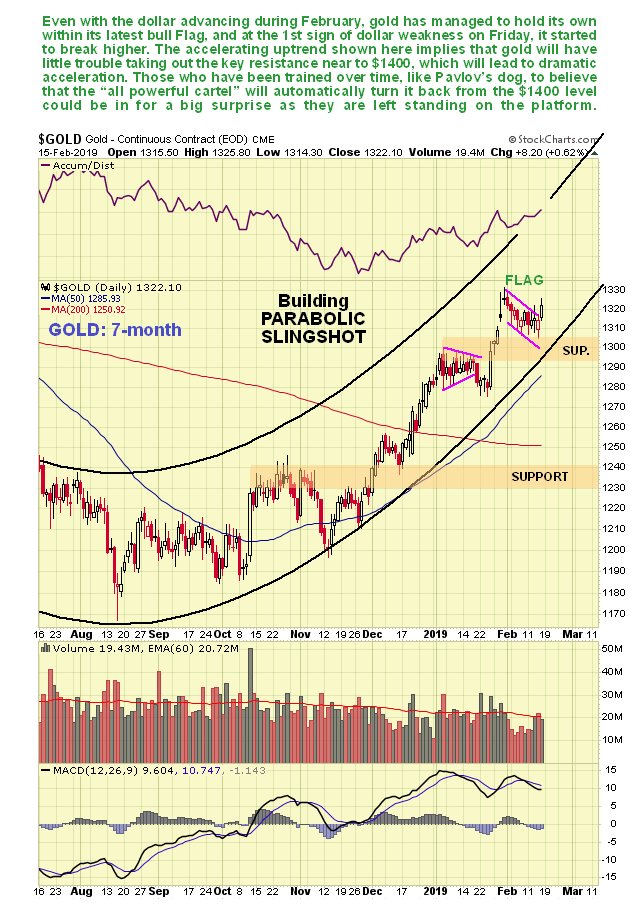
So all it will take now to trigger a gold breakout from its huge base pattern is for the dollar to roll over and drop hard, and as we will see a little later that is precisely what it is setting up to do. Gold has already got the scent of this and has been marching towards the key breakout point in recent weeks in an increasingly vigorous uptrend, as we can see on its latest 7-month chart below. Not only has it powered through its 200-day moving average, leading to a bullish moving average cross, but the uptrend is strengthening to the point that bull Flags and Pennants are starting to form, with the price now on the point of breaking out of the latest one. What is going on is that gold is in the early stages of a parabolic slingshot uptrend as shown, that should soon vault it above the key resistance approaching and around $1400. Once it breaks above this resistance it is expected to accelerate dramatically.
We cannot consider the latest COTs because they are hopelessly out of date, thanks to the government shutdown.
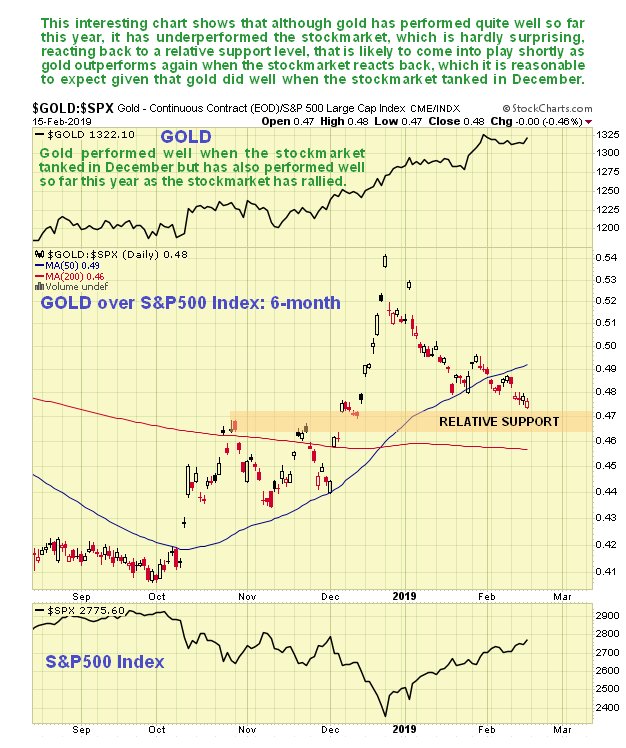
It is most worthwhile comparing golds performance relative to the stockmarket in the recent past. On a 6-month chart for gold over the S&P500 index, with gold at the top and the S&P500 index at the bottom, there are two very important observations to be made. The first is that gold performed well when the stockmarket tanked in December this is important to know, because it means that if the market tanks again soon, gold will likely do well as a safe haven, unlike in 2008, which will probably be due to the dollar being weak at the same time. The 2nd key point to observe is that even though gold has done quite well so far this year, it has still taken a back seat to the stockmarket, against which it has underperformed, resulting in a correction on its relative chart back to relative support, which again suggests that gold will shine if the stockmarket turns and drops hard, as in December.
Alright, so how are Precious Metals stocks shaping up? very well as it happens and we have already lighted on a range great looking stocks on the site.
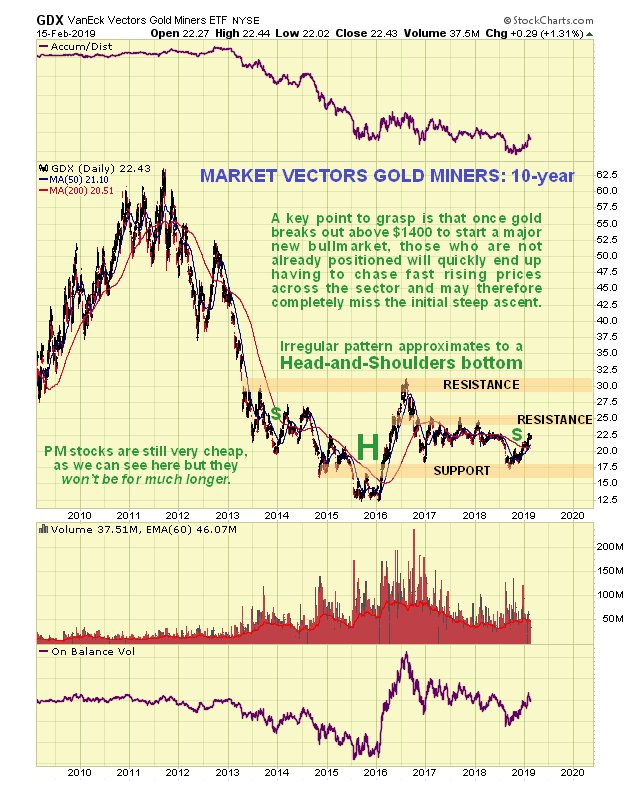
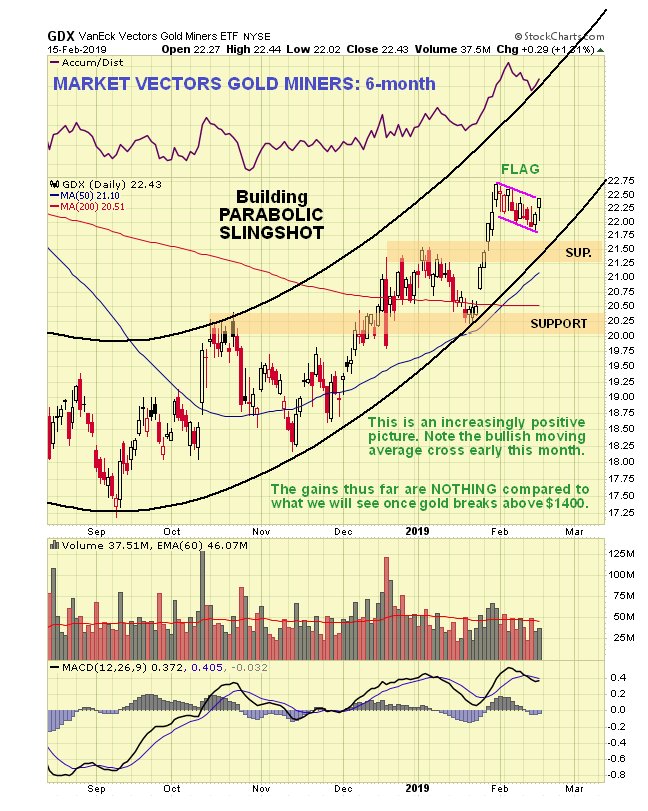
On the 10-year chart for PM stocks proxy GDX, we can see that it is moving towards completion of a giant base pattern that is roughly similar to the one completing in gold, and although it looks like it is rather dragging its feet compared to gold, it is clear that once it gets above the clear line of resistance approaching and at $25, it is likely to accelerate noticeably towards the next resistance in the $30 area at the upper boundary of the pattern. This means that many stocks which are still available at very good prices now are going to become a lot more expensive in a hurry once GDX (and PM indices generally) starts accelerating away to the upside.
The 6-month chart for GDX looks very similar to the 7-month chart for gold, and shows a parabolic slingshot move that is expected to accelerate dramatically to the upside once it breaks above the resistance at the upper boundary of the base pattern in the $30 area. Right now it looks like it is about to advance steeply as it is just starting to break out upside from a small bull Flag.
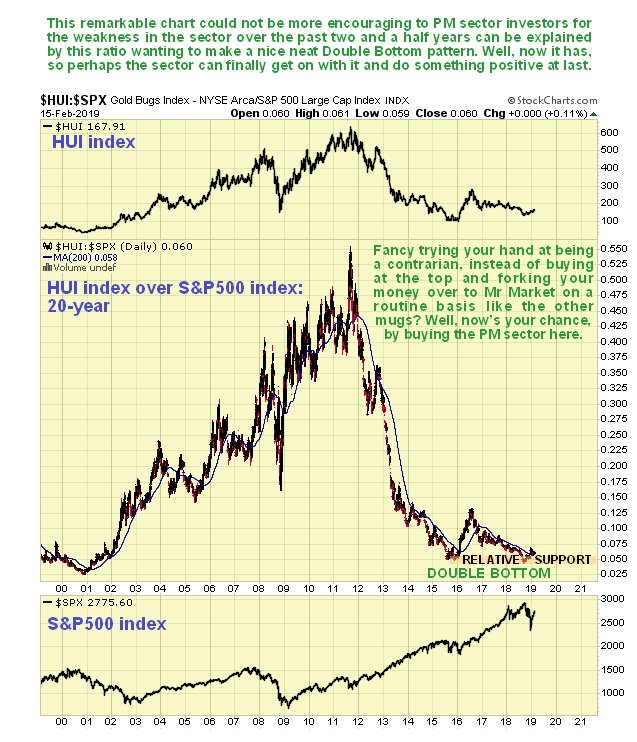
Now we look at a most interesting chart which shows how cheap gold stocks are now compared to the broad stockmarket, the 20.-year chart for the HUI GoldBUGS index over the S&P500 index. It shows that gold stocks have only been this cheap in relation to the general stockmarket on two other occasions in the past 20years late 2000 before the great 2000s sector bullmarket and at the end of 2015, and the sector is only a little above this level now.
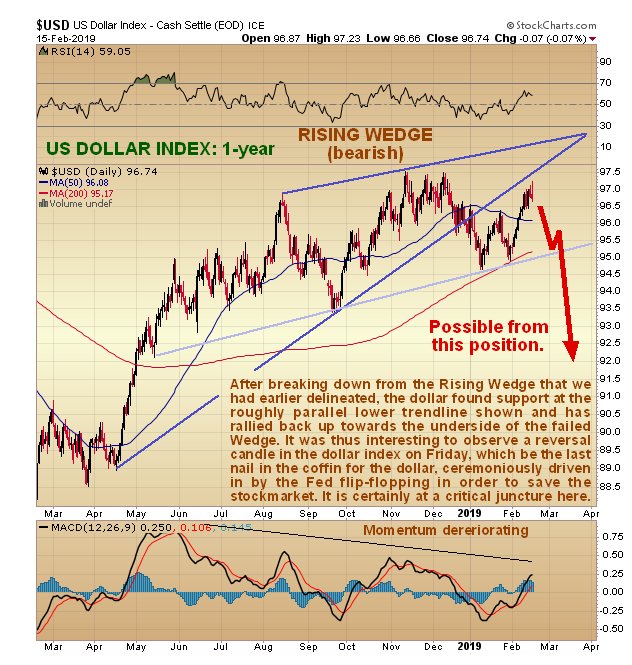
Now we turn to the all-important dollar, all-important that is until it loses its Reserve Currency status. On the 1-year chart for the dollar index we see that early in January it broke down from its bearish Rising Wedge and started to drop away, but its decline was arrested by a parallel channel support line shown in pale blue, and it has since zig-zagged up towards strong resistance at the underside of the failed Wedge and approaching the November December peaks, where it started to run into trouble late last week, with a bearish candle indicating reversal appearing on its chart on Friday this was the reason that the PM sector became perky. It is very vulnerable here, especially after the Fed Chair Jay Powell turned yellow last month in a bid to stop the stockmarket crashing, implying that rate rises will be curtailed, and it is the program of rate rises up to now that has been a key factor driving the dollar higher of course with that gone it could drop and drop hard, which would of course be great news for gold, and commodity prices generally.
Gold looks like it is building up to breaking above the key $1400 level to enter a major growth phase that could dwarf anything seen hitherto, which we can expect to synchronize with the dollar accelerating away to the downside and lead to Precious Metals stocks doing a moonshot which wont be hard considering how depressed and undervalued most of them still are, and how lean and efficient most mining companies are now as a result of having had to battle through hard times for years. If The Cartel try to stop gold going up in this environment by unloading an avalanche of naked shorts, we can expect the market in physical gold to disassociate itself from the paper market to the extent that the latter is bypassed and rendered irrelevant this will probably happen as a result of more and more buyers demanding physical and no longer accepting paper certificates. When this happens gold could go limit up for days on end.
The content on this site is protected
by U.S. and international copyright laws and is the property of GoldSeek.com
and/or the providers of the content under license. By "content" we mean any
information, mode of expression, or other materials and services found on GoldSeek.com.
This includes editorials, news, our writings, graphics, and any and all other
features found on the site. Please contact
us for any further information.
Live GoldSeek Visitor Map | Disclaimer
The views contained here may not represent the views of GoldSeek.com, Gold Seek LLC, its affiliates or advertisers. GoldSeek.com, Gold Seek LLC makes no representation, warranty or guarantee as to the accuracy
or completeness of the information (including news, editorials, prices, statistics,
analyses and the like) provided through its service. Any copying, reproduction
and/or redistribution of any of the documents, data, content or materials contained
on or within this website, without the express written consent of GoldSeek.com, Gold Seek LLC,
is strictly prohibited. In no event shall GoldSeek.com, Gold Seek LLC or its affiliates be
liable to any person for any decision made or action taken in reliance upon
the information provided herein.