A Special Message at Easter from the Precious Metals Sector...
By: Clive Maund
-- Published: Monday, 22 April 2019 | Print | Disqus
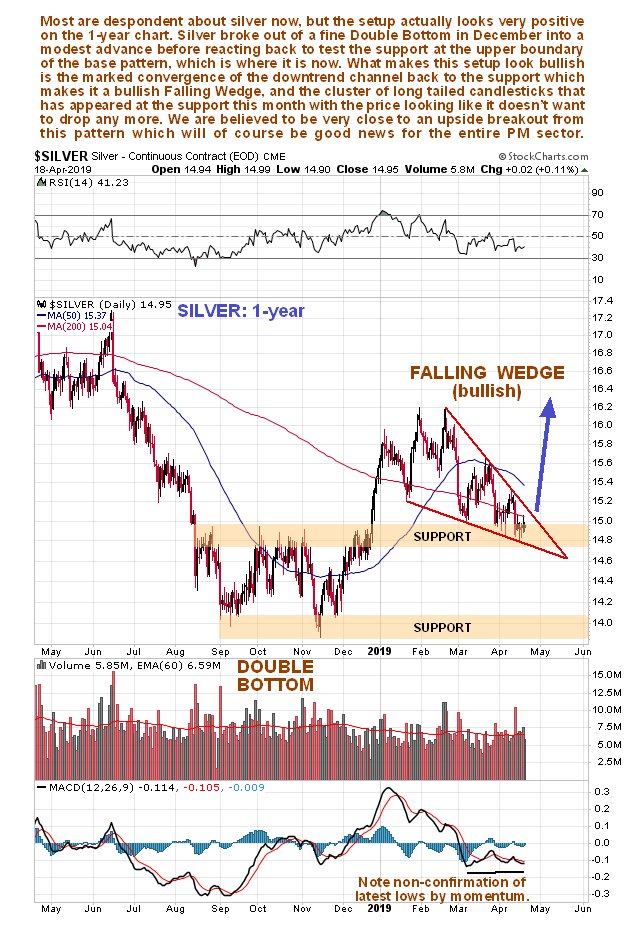
Silver has been a dull market for the past couple of months, yet as we will see the pattern that has evolved in recent weeks is anything but bearish. On the 1-year chart we can really see what is going on. Back last December silver broke out of a fine Double Bottom formation and ran up quickly but the advance turned out to be modest and by late February it had fizzled out and it started reacting back again and last Monday made a new low. However, the rate of decline has been decelerating steadily and it is now apparent that a bullish Falling Wedge is completing, with the strong convergence of its boundaries making it all the more bullish. It is also viewed as no coincidence that the decline appears to have run its course with the Wedge closing up right at important support at the upper boundary of the Double Bottom base pattern.
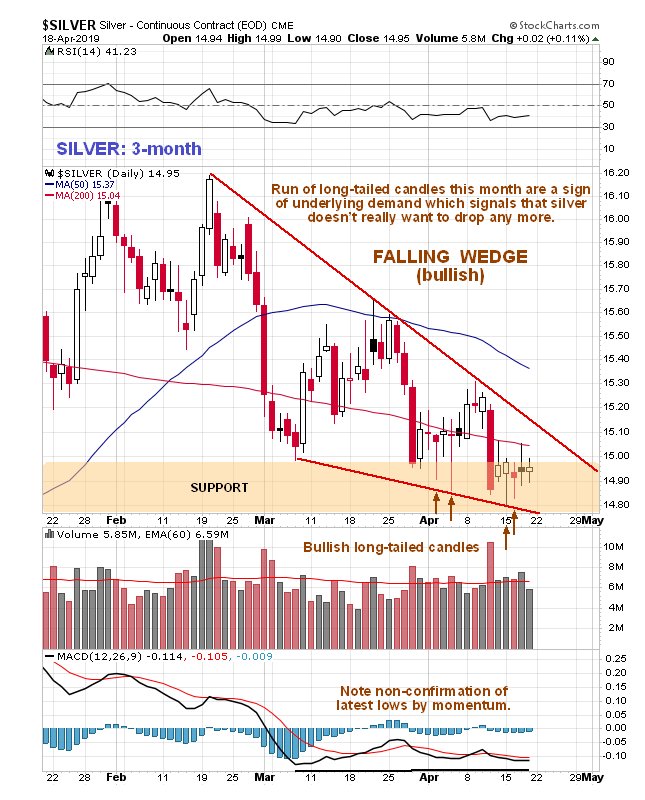
It is thus most interesting to observe a run of bullish long-tailed candles from the start of the month on the 3-month chart which is an indication that the market is rejecting lower prices. We were already on to this in thelast Silver Market update, although at that point we hadnt clocked the Falling Wedge pattern, and while it was a little surprising to see silver drop to new lows about a week ago after those positive candles, it wasnt by much, didnt drop the price out of the Wedge pattern and bullish long-tailed candles have appeared again in recent days. So silver is looking good for a sudden reversal to the upside here, involving a breakout from the Wedge.
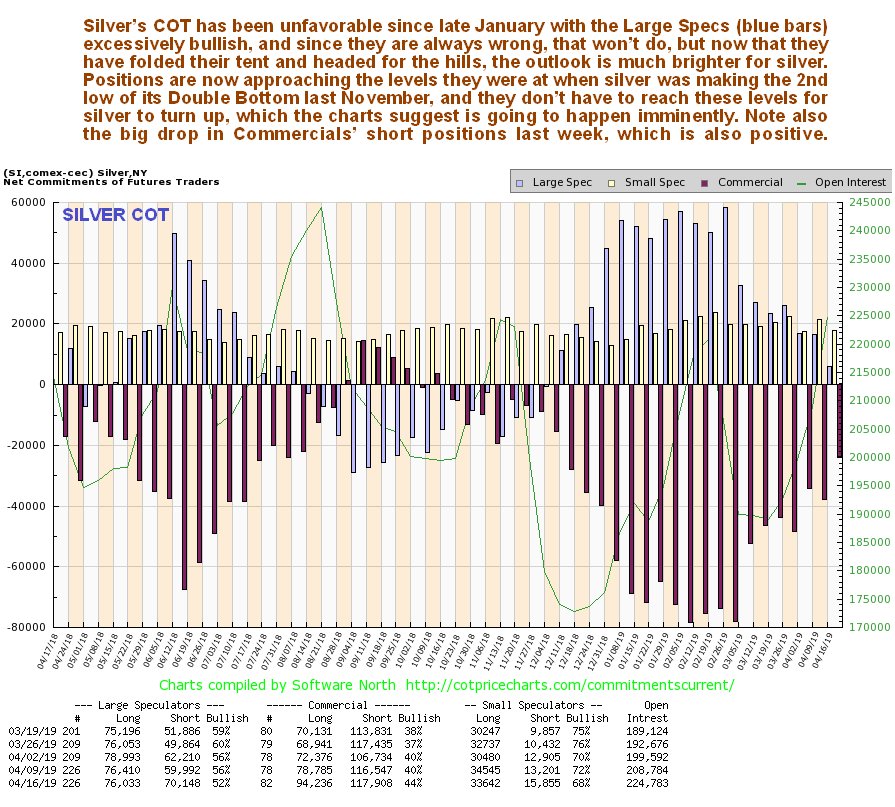
With the setup for silver now looking at its most healthy for a long time, what do the latest COTs have to tell us? You are invited to directly compare the latest COT chart for silver with its 1-year chart above, which is another reason a 1-year timeframe for one of the silver charts was selected.This is edge of the chair stufffor as we can seesilvers COT is at its most bullish since last November when the silver price was down making the 2nd low of its Double Bottom.There was a big drop in Commercials short positions last week and the Large Specs, who love to give up at the bottom, have thrown in the towel and legged it for the hills, which is just what we want to see before a rally. There is scope for some further improvement in the COTs, but with silver now bang on strong support and its Falling Wedge closing up fast it doesnt look like its going to wait for that to happen before it takes off higher.
Click on chart to popup a larger, clearer version.
The practical conclusion to all this is that SILVER AND ALL THINGS SILVER ARE AN IMMEDIATE STRONG BUY HERE.
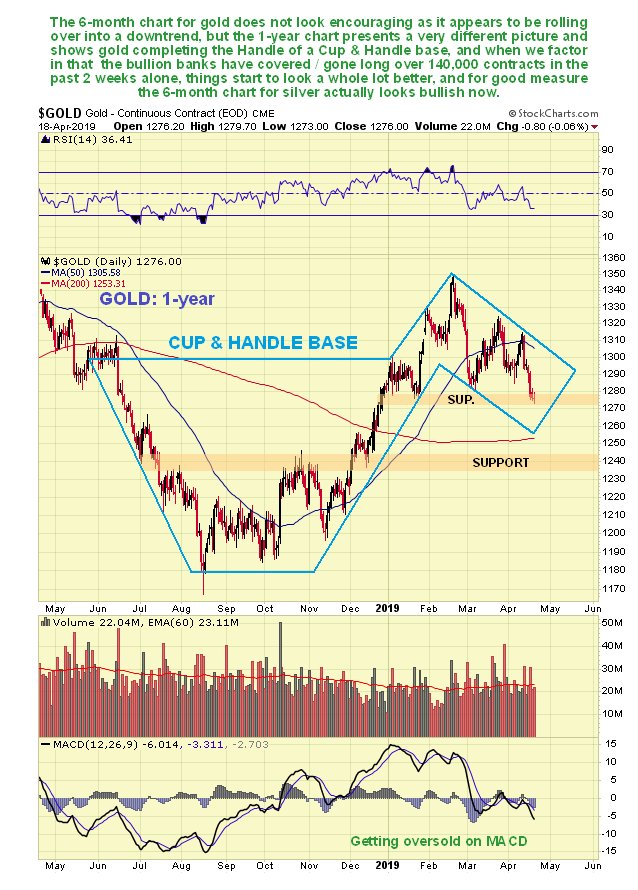
If the setup for silver now looks bullish, which it does, then surely that means the outlook for gold is also positive, does it not? It does, so what do we see on golds charts? The 1st point to make is that golds 6-month chart looks rather awful, with it rolling over and looking like it is breaking down from something resembling a Head-and-Shoulders top, but the 1-year chart presents us with a much different and much more encouraging picture, for as we can see on this chart below what appears to be going on is that gold is currently marking out the Handle part of a sizeable Cup & Handle base, and while there is scope for it to react back more, the silver chart (and the chart for GDX which we look at later) suggests that the reaction may be done already, or very nearly so.
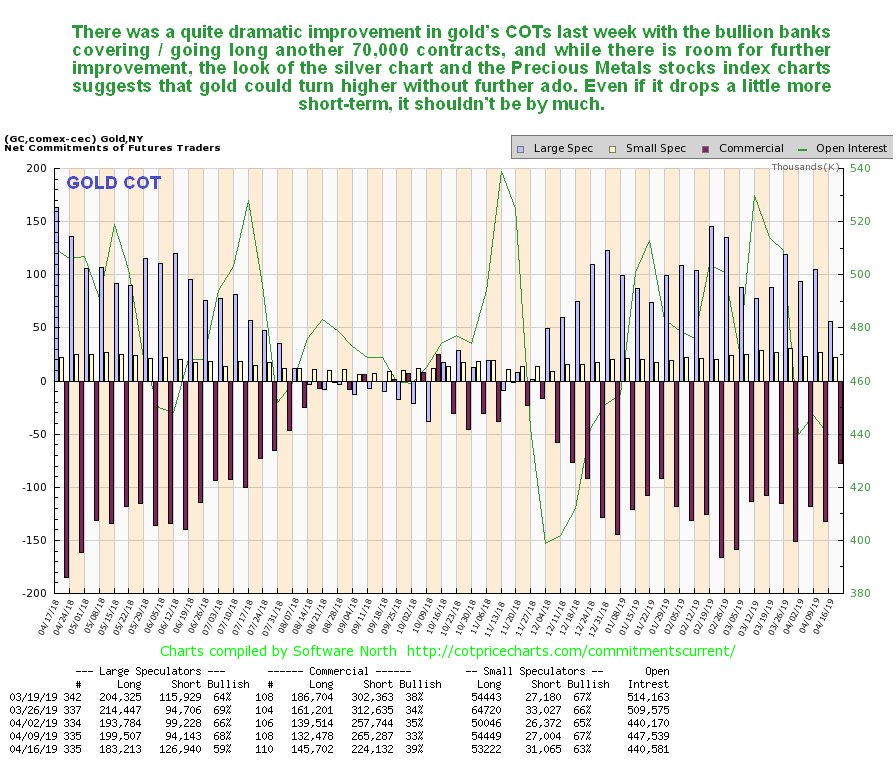
What do the latest COTs have to say about the outlook for gold? They show that there was a big improvement last week, with a marked reduction in Commercial short and Large Spec long positions and while we can see that there is still room for further improvement, it is not a requirement that positions have to fully unwind before an uptrend in gold starts.
Click on chart to popup a larger, clearer version.
As my illustrious associate in Toronto puts it
Happy to report that the weekly Gold COT data just came out.
The Bullion Banks covered/went long ANOTHER 70 000 contracts (7 million ounces!!).
Thus in last 2 weeks alone , they have COVERED/went long OVER 140 000 contracts OR OVER 14 million ounces of Gold!!!
Cut off date for this weeks data was Tuesday April 16 2019.
Gold was weaker AFTER the report. Meaning, 99% probability Banks covered/went long even MORE after the report.
You do NOT mess with the FED, and YOU DO NOT mess with the Bullion Banks!!
As I have been saying for weeks as Gold was above $1300, best thing for Gold is to dip down one more time to scare more people off the wagon.
Well, it has definitely done that.
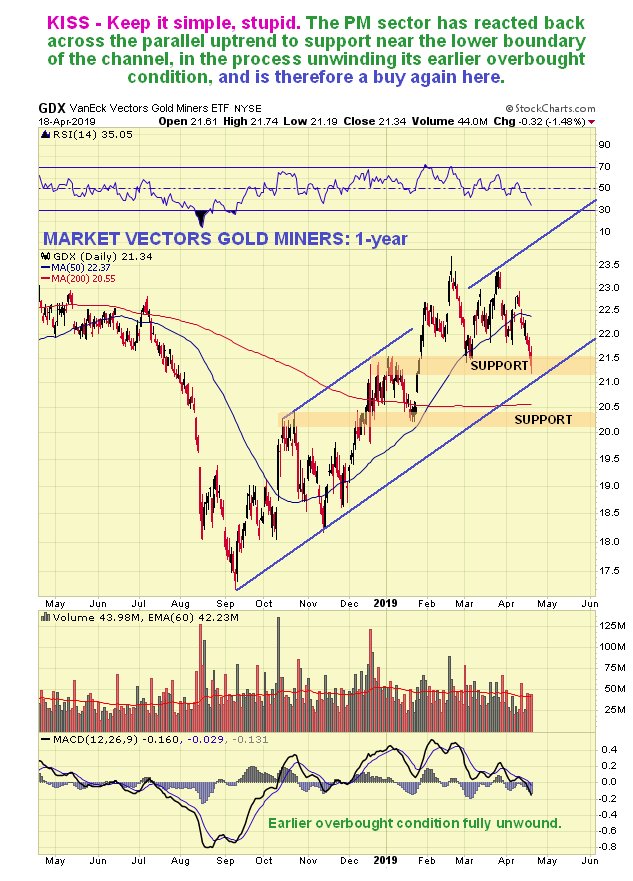
Alright, so if this is how gold and silver look, then what about Precious Metals stocks? Happily the message of the PM sector charts is simple and clear, and we dont need to make it more complicated than it is.
The 1-year chart for GDX shows that the sector is continuing to advance within a fine parallel uptrend channel, with the metals reaction of recent weeks being the occasion for the sector to consolidate by traversing sideways within the uptrend channel. This consolidation / reaction within the channel has allowed time for the earlier overbought condition (MACD) to unwind and for the lower channel boundary to catch up with the price, thus creating the springboard for another significant upleg to develop from here.So this looks like an opportune buy spot for the PM sector here.
Can the Precious Metals sector advance if the broad stockmarket continues higher? Of course, because if the stockmarket continues to advance because of Central Bank buying on a grand scale to goose it higher, it means QE4 and eventual inflation /hyperinflation as we continue inexorably along the road already trodden by Venezuela and Zimbabwe.
The overall conclusion is that the Precious Metals sector is at or very close to an important bottom here and this is a good time to buy.
The content on this site is protected
by U.S. and international copyright laws and is the property of GoldSeek.com
and/or the providers of the content under license. By "content" we mean any
information, mode of expression, or other materials and services found on GoldSeek.com.
This includes editorials, news, our writings, graphics, and any and all other
features found on the site. Please contact
us for any further information.
Live GoldSeek Visitor Map | Disclaimer
The views contained here may not represent the views of GoldSeek.com, Gold Seek LLC, its affiliates or advertisers. GoldSeek.com, Gold Seek LLC makes no representation, warranty or guarantee as to the accuracy
or completeness of the information (including news, editorials, prices, statistics,
analyses and the like) provided through its service. Any copying, reproduction
and/or redistribution of any of the documents, data, content or materials contained
on or within this website, without the express written consent of GoldSeek.com, Gold Seek LLC,
is strictly prohibited. In no event shall GoldSeek.com, Gold Seek LLC or its affiliates be
liable to any person for any decision made or action taken in reliance upon
the information provided herein.