Gold Market Update - investors should take measures to protect themselves
By: Clive Maund
-- Published: Monday, 9 September 2019 | Print | Disqus
Although a major Precious Metals sector bullmarket has certainly started, various fundamental and technical factors came together last week to suggest that a significant correction to the recent strong runup has now started.
The main fundamental development was the announcement that there will be a Trade War summit between China and the US early next month, with hopes being expressed that this may lead to compromise or some kind of truce. Whilst the chances of improvement may be slim, the market has got what it wants for now which is hope, and this hope should continue at least until this meeting, which provides the excuse for the markets to go risk on until then, which is why the stockmarket broke higher last week, delaying but not eliminating our crash scenario.
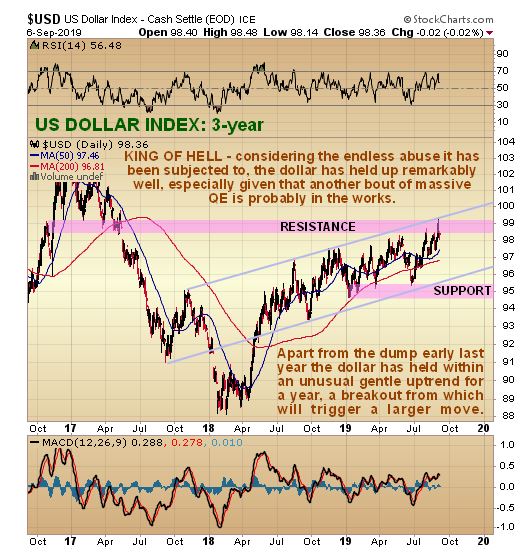
A return to risk on is clearly not good for the Precious Metals which, until last week, had been benefitting from a flight to safety as had the dollar, creating the unusual situation where the dollar and gold were rising at the same time. Now, in a risk on environment they are suddenly out of favor again.
In addition to this fundamental argument we have a range of technical indicators pointing to a correction in the Precious Metals sector that we will now look at. They include its overbought status, overly bullish sentiment readings and COTs showing extreme readings.
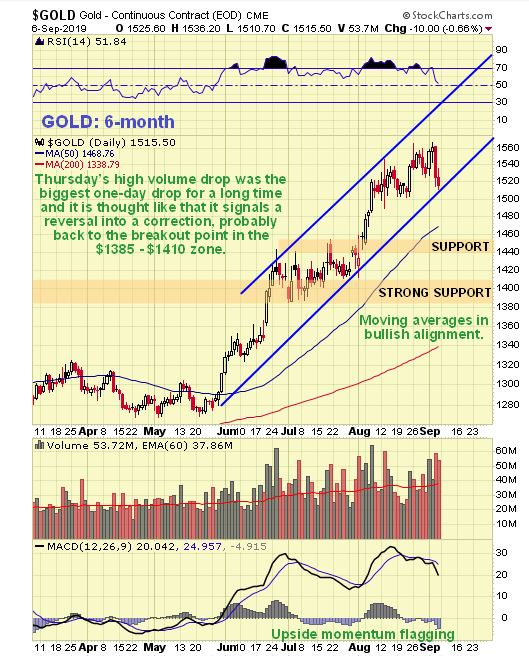
Starting with golds 6-month chart, we can see that it doesnt look too bad yet, but if we look more closely we can see that it is on the point of breaking down from the rather steep uptrend in force from late May, with it having dropped back on quite high volume the past 2 trading days, and it is noteworthy that Thursdays drop was the biggest 1-day drop for a long time, making it more likely that it signals a reversal. In addition, the MACD indicator shows that momentum is starting to flag.
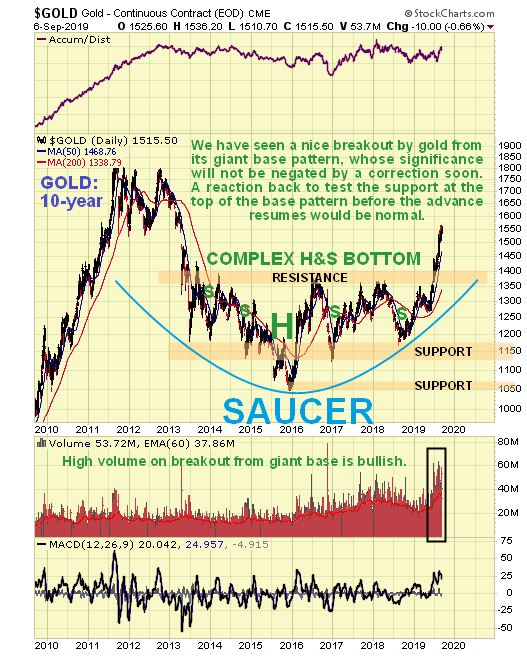
So, how far could gold react back? It happens more often than not that after a price breaks clear out of a giant base pattern, as gold did from its giant complex Head-and-Shoulders bottom or Saucer base shown on our 10-year chart, that it then returns to test support at the upper boundary of the base pattern before turning higher again. That could happen again and it would throw a lot of investors in the sector who are now of the view that we are off to the races. So, if it does react back that far dont be dismayed on the contrary it would throw up one last great buying opportunity.
We have had a rather unusual situation in the recent past where the dollar and the Precious Metals have been strengthening together. This is because, in a risk off environment both have been considered safe havens. In a risk on environment this logic works in the other direction so that the dollar and the Precious Metals may both react back together. On the 3-year chart for the dollar index we can see that it is at a good point to turn lower, despite its still bullishly aligned moving averages, as its persistent gentle uptrend has brought it up to the significant resistance level shown.
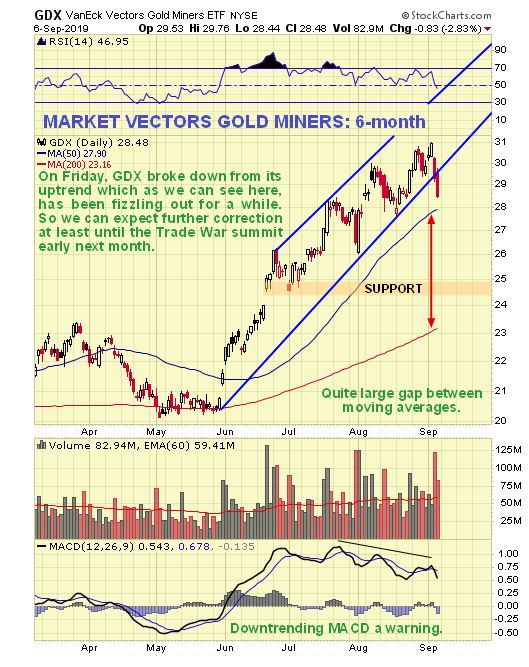
While PM stocks continued to push higher in recent weeks, the decline was losing momentum, as revealed by the downtrending MACD indicator on the 6-month GDX chart below, which led to its starting to break down on high volume on Thursday and Friday. Although it hasnt yet broken down from the uptrend and below its 50-day moving average, this looks set to happen soon.
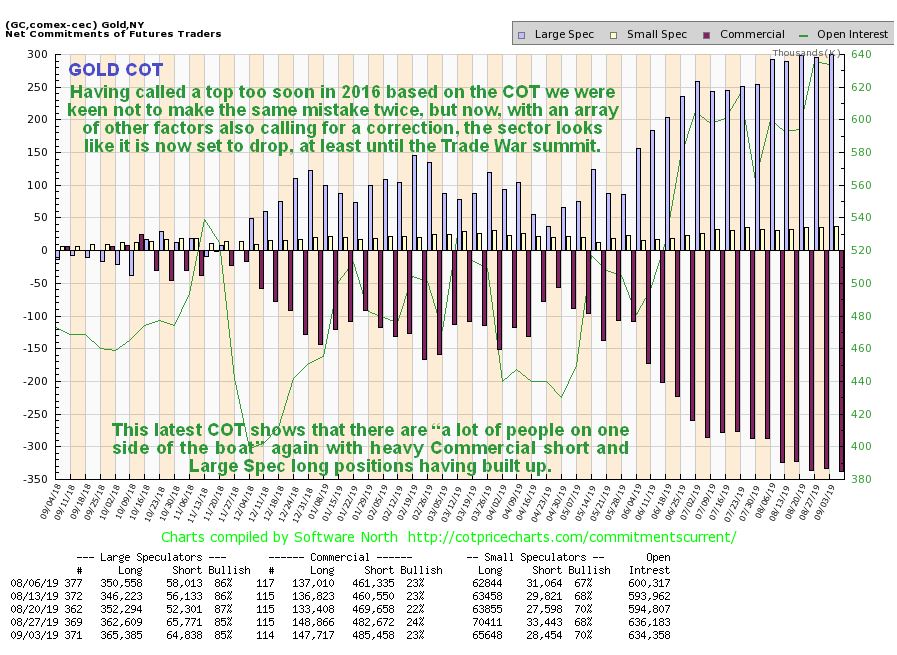
So how about COTs and sentiment? we will now proceed to look at them. We had been wary of calling a top too soon based on the increasingly lopsided COTs, having called a top too soon during the runup early in 2016, but now, given the other factors that we have considered, in particular the negative developments last week, the latest gold COT, which shows high Large Spec long positions and heavy Commercial short positions, certainly makes a reaction back by gold now or soon a lot more likely
Click on chart to popup a larger, clearer version.
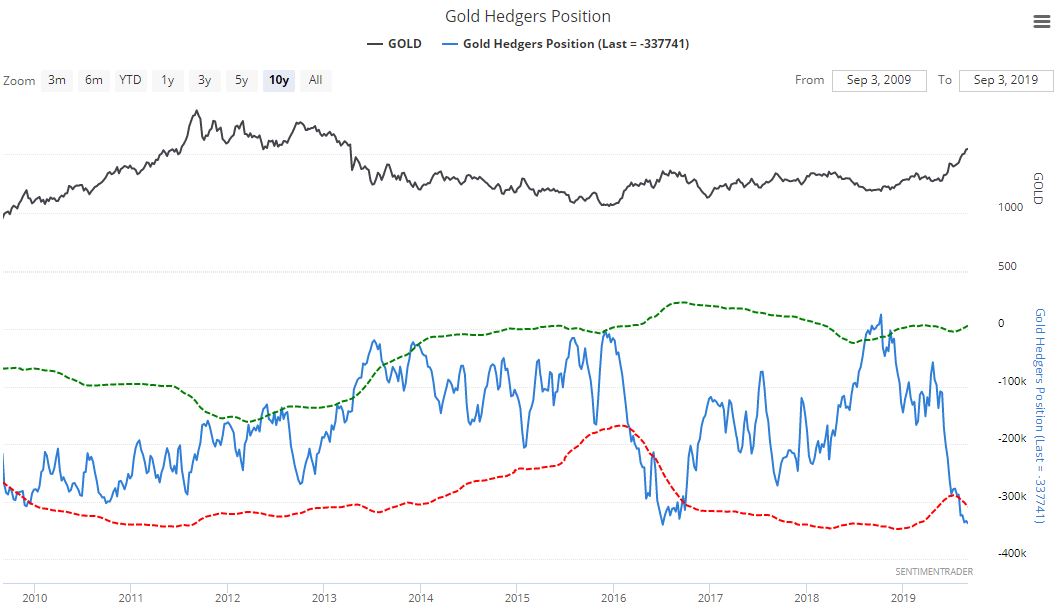
The COT is backed up by the latest Hedgers chart, which goes back to 2010, which shows that positions match the extreme reached in the Summer of 2016, which as we know was followed by a brutal correction for the rest of the year. While a correction certainly looks likely it shouldnt be so deep, because there is a big difference this time round, which is that gold has broken out into a major new bullmarket it was still in a basing phase in 2016.
Click on chart to popup a larger, clearer version.
Chart courtesy of sentimentrader.com
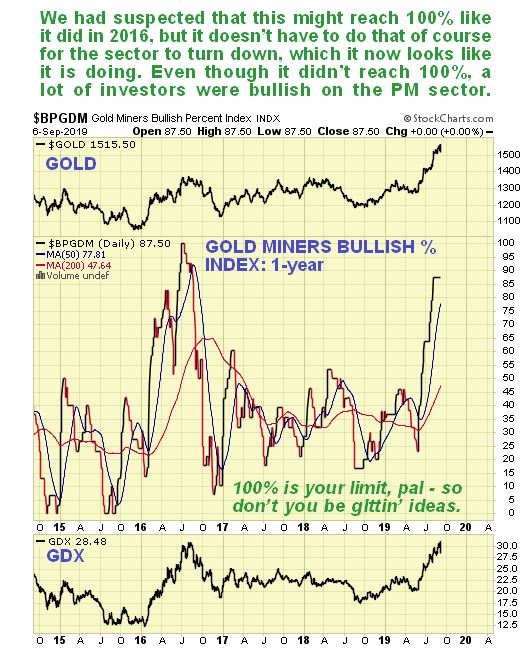
Lastly, the Gold Miners Bullish % Index is still at 87%, and while we waiting to see if it would hit 100% as it did in 2016, it doesnt have to of course before a reversal occurs, and 87% certainly shows that enough people are bullish to warrant a trip to the fleecing shed.
Investors in the Precious Metals sector should therefore take measures to protect themselves, which include stepping aside for a while, or if staying long, hedging with inverse ETFs such as DUST, or options (options are much more cost effective), GLD being very suitable are they are highly liquid with narrow spreads, and then we watch for the expected correction to unfold, aware that when it has run its course, we will be presented with a MAJOR BUYING OPPORTUNITY.
The content on this site is protected
by U.S. and international copyright laws and is the property of GoldSeek.com
and/or the providers of the content under license. By "content" we mean any
information, mode of expression, or other materials and services found on GoldSeek.com.
This includes editorials, news, our writings, graphics, and any and all other
features found on the site. Please contact
us for any further information.
Live GoldSeek Visitor Map | Disclaimer
The views contained here may not represent the views of GoldSeek.com, Gold Seek LLC, its affiliates or advertisers. GoldSeek.com, Gold Seek LLC makes no representation, warranty or guarantee as to the accuracy
or completeness of the information (including news, editorials, prices, statistics,
analyses and the like) provided through its service. Any copying, reproduction
and/or redistribution of any of the documents, data, content or materials contained
on or within this website, without the express written consent of GoldSeek.com, Gold Seek LLC,
is strictly prohibited. In no event shall GoldSeek.com, Gold Seek LLC or its affiliates be
liable to any person for any decision made or action taken in reliance upon
the information provided herein.