Crash Update - Including Downside Targets for the DJIA and S&P 500 Indices...
By: Clive Maund
-- Published: Wednesday, 26 February 2020 | Print | Disqus
Clive Maund
The market crashcalled for on the site on the 15th, right before it started, is now going full bore, and in this update we are going to consider the short-term outlook, especially insofar as it impacts upon our Tech sector puts, and also the grim longer-term outlook.
A full-on in your face catalyst for the crash has arrived in the form of the Covid-19 or coronavirus, which has already brought the Chinese economy to a virtual standstill, thus disrupting global supply chains, and now threatens to wreak havoc elsewhere, not least in the United States itself. The everything bubble had reached incredible extremes and this virus crisis catalyst was just what was required to burst it, and now its started no amount of Central Bank money pumping or wild promises will stop it.
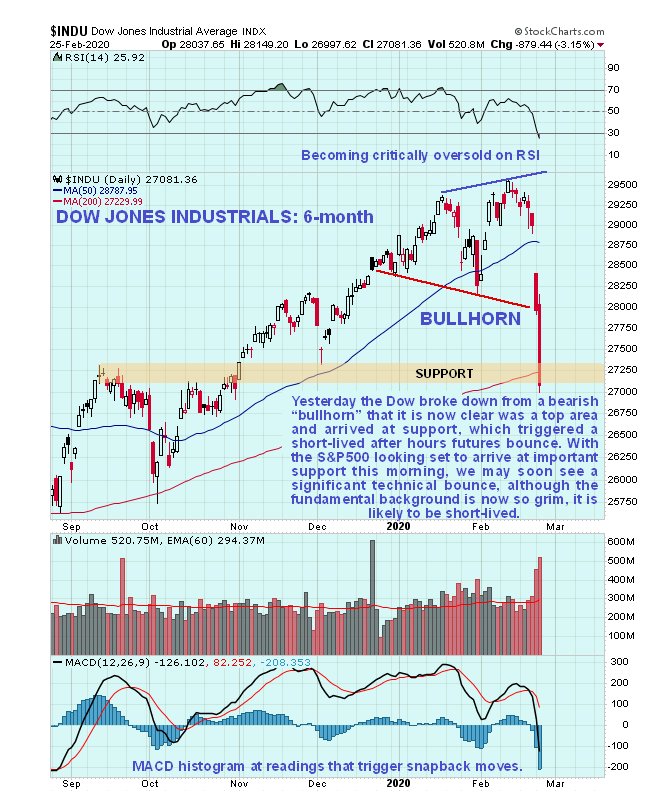
Well start by looking at the latest 6-month charts for the Dow Jones Industrials and the S&P500 index. On the Dow Jones chart we see that after pausing at the support line at the lower boundary of a bearish Broadening Formation or Bullhorn the day before, it crashed this support yesterday and plunged again by about 880 points, and this latest drop has brought it down to a support level near to its rising 200-day moving average, which generated an after hours bounce in futures last night that at the time of writing has fizzled out.
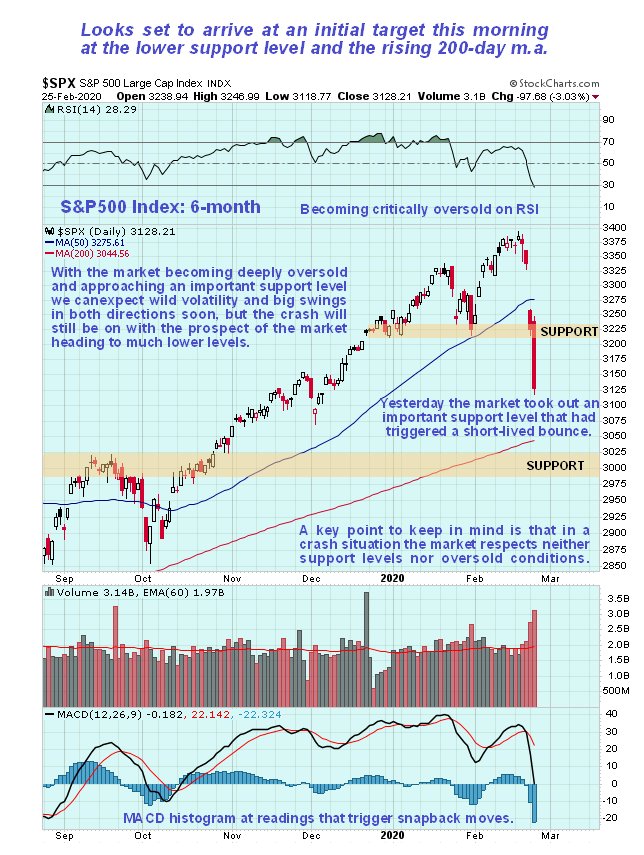
Meanwhile the S&P500 index also crashed a line of support yesterday at the lower boundary of a flat-bottomed Broadening Formation and plunged as well, but in the case of this index, it has not yet arrived at the important support level shown in the 3000 area, but it may do during the day today, possibly sometime during the morning, and even though market panics have scant respect for oversold limits or support levels, it will be so oversold at this juncture that it could trigger a technical short-covering bounce, which is why in a follow up article we will be looking to offload some of our Puts for a massive profit.
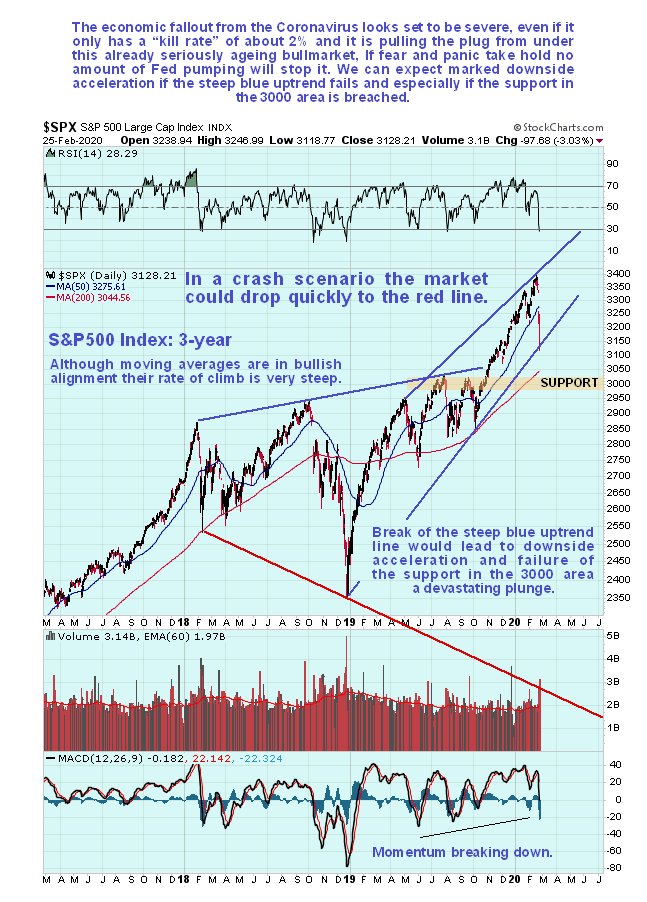
To get an idea of how far the market could drop during this crash we must zoom out and look at longer-term charts. On the 3-year chart for the S&P500 index we see that late last year the market broke out upside from a bearish Broadening Formation and then ran up, but this breakout did not negate the bearish implications of the pattern on the contrary, what often happens after such a breakout is that the market turns and crashes down through the pattern, which is what we are starting to see now. The index is already approaching its rising 200-day moving average and if it slices through that, and more seriously then drops through the support in the 3000 area, then we are likely to see even more downside acceleration with the market plunging vertically and cratering. Note, however, that we may first see a technical bounce from the support in the 3000 zone. Once the support in the 3000 zone fails, the index will target the red lower support trendline of the Broadening Formation, which if it gets there would obviously result in catastrophic losses.
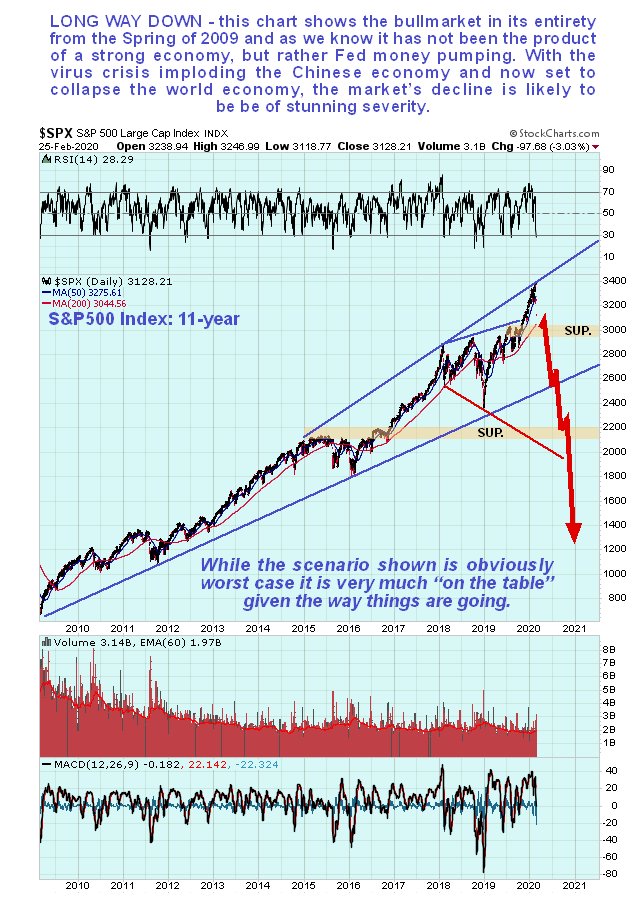
But it gets even worse the large Broadening Formation shown on the 3-year chart is a topping pattern that follows a multi-year bullmarket from early 2009, as we can see on our 11-year chart for the S&P500 index. What this means is that the crash may not halt at the lower red line of the Broadening Formation it might continue even lower as shown. This is clearly a very extreme scenario, but nevertheless it is very possible because of the collapse of the everything bubble triggered by a global pandemic that causes massive disruption and economic gridlock.
In a follow up due to be posted later this morning, we will consider what to do with our Tech sector Puts, in which we already have massive profits. If for any reason this article does not appear by the open, for example because I suffer a power outage, then go ahead and take profits in all Puts, because a technical bounce looks likely soon, and the plan is to book our huge profits and then roll a percentage of them into lower cheaper strikes, thus reducing potential trimming of our gains in the event of a snapback rally.
The content on this site is protected
by U.S. and international copyright laws and is the property of GoldSeek.com
and/or the providers of the content under license. By "content" we mean any
information, mode of expression, or other materials and services found on GoldSeek.com.
This includes editorials, news, our writings, graphics, and any and all other
features found on the site. Please contact
us for any further information.
Live GoldSeek Visitor Map | Disclaimer
The views contained here may not represent the views of GoldSeek.com, Gold Seek LLC, its affiliates or advertisers. GoldSeek.com, Gold Seek LLC makes no representation, warranty or guarantee as to the accuracy
or completeness of the information (including news, editorials, prices, statistics,
analyses and the like) provided through its service. Any copying, reproduction
and/or redistribution of any of the documents, data, content or materials contained
on or within this website, without the express written consent of GoldSeek.com, Gold Seek LLC,
is strictly prohibited. In no event shall GoldSeek.com, Gold Seek LLC or its affiliates be
liable to any person for any decision made or action taken in reliance upon
the information provided herein.