-- Published: Sunday, 3 February 2019 | Print | Disqus
- All Models Are Wrong, but Some Are Useful
- Starting Valuation Matters
- Empty Quarter
- Fun with Forecasting: Choosing Your Time Periods
- Late in the Cycle
- Removing Emotions
- Can It Get Any Better Than This?
- Puerto Rico, Dallas, Cleveland, Cleveland, Cleveland, and ???
Plans are worthless, but planning is everything.
US President Dwight D. Eisenhower
There are many versions of that Eisenhower quote he learned in the Army. Nixon, who probably heard it from Eisenhower directly, modified it to
plans are useless, but planning is indispensable. Both are variations on the theme, No battle plan survives first contact with the enemy.
Today well look at what we should expect from our investing. In case you havent noticed, financial markets are really a giant expectations game. A company can report great quarterly results and still get crushed if earnings are less than analysts expected.
I have talked about this before: All economic, budget, and investment models are based on assumptions. Those assumptions generally use past experience to project the future. I actually heard a well-respected Federal Reserve economist admit that forecasts using the Phillips curve are fraught with problems. When asked, Then why do you keep using it? the (paraphrased) answer was, We need something to base our projections on. We dont have any other better model, so we use it. Knowing their method will deliver faulty results, they still use it anyway.
During World War II, Nobel laureate Ken Arrow was assigned to a team of statisticians to produce long-range weather forecasts. After a time, Arrow and his team determined that their forecasts were not much better than pulling predictions out of a hat. They wrote their superiors, asking to be relieved of the duty. They received the following reply, and I quote: The Commanding General is well aware that the forecasts are no good. However, he needs them for planning purposes.
With that acknowledgment, and since we are going to discuss potential future investment returns for your own planning purposes, it is important to recognize the choice of which data you use, which assumptions you make, and which models you select will have a big influence on your plans and thus your outcomes.
Let me make one obvious, at least to me, point. Many financial advisors, when developing retirement plans, use a simple long-term average of the stock market. They often assume a 7% or 8% growth in the equity portion of a portfolio both pre- and post-retirement.
I think the data shows that is an extremely unwise assumption. If your investment and retirement plans assume such results, I suggest you reconsider. Maybe find a financial planner or software program with a bit more sophistication.
The above heading is often attributed to the statistician George Box. My goal today is not to help you create an accurate model, but a useful one. One-size-fits-all assumptions about future returns are worse than useless. They are misleading and potentially dangerous. I hope to help you avoid that result.
This process is really just a collision of hope and reality, and its inevitable because (sorry if this shocks you) none of us know the future. We can make reasonable forecasts, but theyre always uncertain.
But heres the important point. We need context with which to greet the uncertain future. Thats why Eisenhower, Nixon, and so many others have said that planning is essential, even if we dont know the future.
I had a real-world example last week when visiting with Andy Marshall. In the 1970s, he was one of a few to argue that Soviet GDP was likely a fraction of CIA and State Department estimates. Was he right in all its particulars? I think he would say no, but he had the direction right and following his guidelines in defense planning delivered a much better outcome for the US.
So I dont want anyone to read this and think Im against planning. It is critical to the process. We just need to be very careful about where we get our inputs. Our governments official analysis of Soviet GDP was bad input. The data Andy relied on was much better and eventually proved more correct.
Last week in How Should We Then Invest?, I said the next decade will be profoundly and deeply different than the past, and we will get different results than most people expect. That raises the question, different in what ways? What are these expectations I think will prove wrong?
I want to dig into that question a little deeper, and maybe offer some ideas to raise your expectations. But as youll see, you may not want to raise them too much.
As noted, our inability to foresee the future is both a problem and an opportunity. While Im fairly confident in my 10-year forecast of increased volatility and eventual bear market, I cant rule out a shorter-term market melt-up before the meltdown. Bull markets end when optimism peaks, because at that point everyone who is going to buy into the market has done so. Then prices have nowhere to go but down.
What could cause a market melt-up? What if the Trump administration announces a resolution with China and the May government in the UK announces a successful Brexit deal? Combine that with recent Federal Reserve dovishness, and a relief rally could quickly evolve into a melt-up. Of course, if all those circumstances turn negative, you could see the opposite.
As Benjamin Graham taught us, in the short run markets are a voting machine; in the long run they are a weighing machine. The short-run voting machine analogy is just another way to talk about optimism.
Fortunately, we have a way to measure optimism, beyond just a self-reported emotional state. Earnings multiples tell us what people are actually willing to pay for the expectation (but not the certainty) of future profits. High P/E ratios signal confidence. Very high P/E ratios signal overconfidence.
Occasionally, I feature the work of Ed Easterling of Crestmont Research. He has co-authored several letters and chapters in my books. I really pay attention to his important and useful research. Ed looks at market valuations of long periods and compares them to subsequent returns. Historically, the correlation is pretty tight. When you buy into the market at above-average P/E ratios, the next decade brings below-average returns, assuming you buy and hold the entire period.
Ed just updated his data for 2018, so heres the latest.
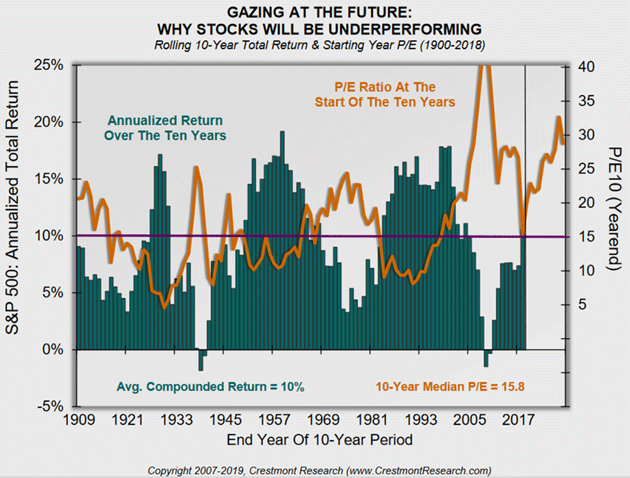
Source: Crestmont Research.
If you buy when the orange valuation line is high, returns for the next 10 years (the green bar directly below) are generally less than impressive and sometimes dismal.
This shouldnt be surprising. As Ed says, Starting valuation matters. If you overpay you will likely underperform. And if you bought into stocks prior to December, you probably overpaid. The time to buy is, like the saying goes, when blood is running in the streets. And thats not now, last quarters volatility notwithstanding.
You can look at this in other ways, too. Rob Arnotts team at Research Affiliatescalculates 10-year expected returns for many asset classes based on expected cash flows and changes in asset prices, instead of extrapolating past returns.
Research Affiliates further calculates expected volatility, which lets them produce the classic risk-reward scatterplot below. The vertical axis is expected return, the horizontal axis is expected volatility. The ideal investment (high return, low volatility) would be in the upper left quadrant. Unfortunately, that area is blank.
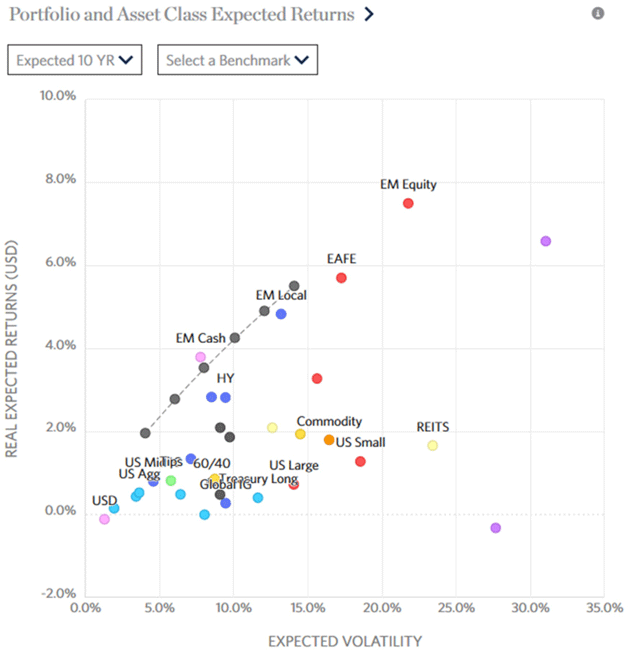
Source: Research Affiliates
Instead, we see a wide variety of asset classes clustered in the lower left, indicating low returns and low volatility. Robs forecast is pretty bleak if you want more than about 4% returns over the next decade. Some major pension plans (which assume 7% or more) will be in serious trouble if this is anywhere close to correct.
You can view more details and play with different scenarios using the interactive version on Robs website. I personally find the interactive version very instructive and, for this geek at least, entertaining and fun. Good luck finding better news, though.
Longtime readers will know that from time to time I post the seven-year asset class real return forecast from GMO. It was fairly accurate and useful from 20002007. Looking back from 2010, the GMO forecast was not as accurate or useful about future potential returns.
But this offers a teaching moment. It illustrates the George Box quote, Essentially, all models are wrong, but some are useful. The GMO model assumes some mean reversion. That is, valuations and thus returns will come back towards the long-term average. Lets look at the actual forecast chart as of the end of 2018. Notice that some asset classes are projected to be negative.
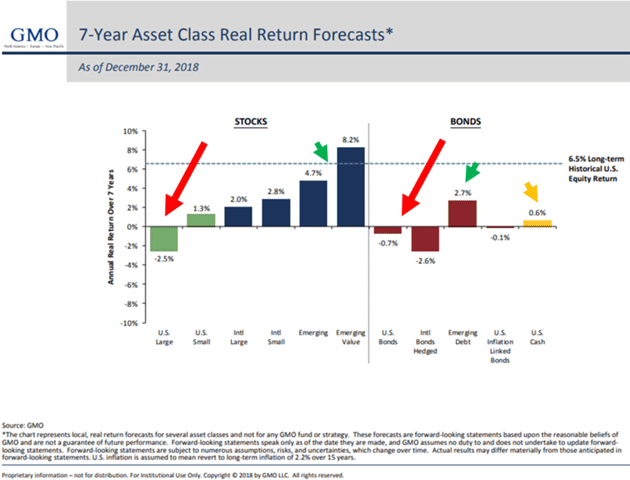
Source: gmo.com
While the accuracy of this model seven years out is not entirely random, there is some dependence on future economic conditions, which are unknowable. For the seven years going forward from 2010, the markets faced the unknowable event of quantitative easing, which I think we would all admit changed valuations and stock market prices.
Even so, the useful part of the GMO forecast is not whether the projected returns are correct, but what they tell us about mean reversion. The market is a lean, mean reversion machine over long time periods. Short time frames (like seven years) can vary but we can have a great deal of mathematical confidence that the markets will eventually revert to the mean. Future returns may in fact change the mean to which markets will revert, but the fact that reversion will happen is fairly straightforward.
That means future returns will be lower than the long-term average. We are reaching a point of the cycle where mean reversion will become a bigger factor.
I had the pleasure today of listening to Howard Marks at the Tiger 21 conference in Boca Raton, where I will be speaking tomorrow. I should note that Howard will be speaking at my conference in the middle of May, which I will mention below.
Howards latest book, Mastering the Market Cycle, Getting the Odds on Your Side, is a must-read for investors. He talks about market cycles and getting them to work for you. While he thinks that we may be late in the cycle, we dont really know the future or what inning it is. A direct quote: We sometimes have a feeling for what is going to happen, but we never know when. On stage this week, Howard kept emphasizing the concept of uncertainty.
This next chart needs a little explaining. It comes from Ned Davis Research via my friend and business partner Steve Blumenthal. It turns out there is significant correlation between the unemployment rate and stock returns
but not the way you might expect.
Intuitively, you would think low unemployment means a strong economy and thus a strong stock market. The opposite is true, in fact. Going back to 1948, the US unemployment rate was below 4.3% for 20.5% of the time. In those years, the S&P 500 gained an annualized 1.7%.
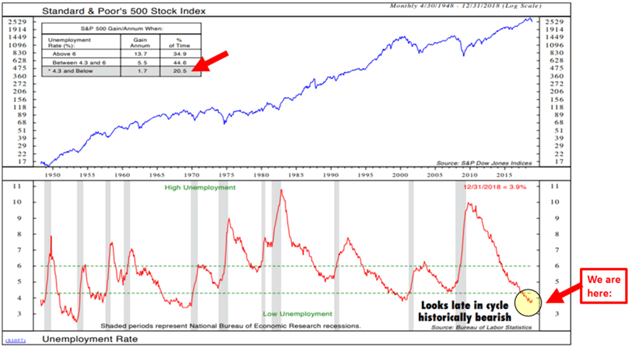
Source: Ned Davis Research
Now, 1.7% is meager but still positive. It could be worse. But why is it not stronger? I think because unemployment is lowest when the economy is in a mature growth cycle, and stock returns are in the process of flattening and rolling over. Sadly, that is where we seem to be right now. Unemployment is presently in the low range which, in the past, often preceded recession.
It is certainly possible this time will be different in a good way. Maybe we can sustain low unemployment this late in a cycle and still see stocks deliver good returns. I wouldnt rule it out. But I wouldnt expect it, either.
Consistent with Ed Easterlings chart, the time to buy is when fearand the unemployment rateis at its highest, not its lowest. Thats not the case now.
All the above examples are directed toward long-term portfolios. Thats not where most of us are. Its true, at least historically, that buy and hold works well if you stick with it and if you allow sufficient time. But in my experience, very few investors can stick with it. They see their net worth shrinking, get scared and bail out, typically at just the wrong time. Then they re-enter at the wrong time and the cycle repeats.
There have been several historical periods where actual returns for 20 years were negative. Buy-and-hold starting in 1966 didnt see a nominal positive return for 16 years, and it took 26 years to get an inflation-adjusted positive return. Most of us would think of 20 years as the long term. As the charts Ive used above illustrate, your starting point really does make a difference in what your returns will be over the next 101520 years.
So what do we do in the meantime? I have been arguing for some time that instead of the typical investment strategy of diversifying asset classes, we need to diversify trading strategies as our risk control. And as Ive written and demonstrated numerous times, emotional decisions arent effective risk control. You need a quantifiable, non-emotional decision process.
If you are not using investment advisors that offer such an advantage, and you are running your own portfolio, the better approach, in my opinion, is to recognize this tendency and counteract it with a disciplined risk-management process. In most cases, that means removing emotions from the equation. But how?
There are all kinds of methods, but heres one very simple one as an example. The 200-day moving average identifies an assets long-term price trend. You can use it to stay on the right side of the trend. Stay exposed when the current price is above the 200-day MA, get out when it drops below.
Is this perfect? No. It will make you miss opportunities and occasionally keep you in the market through a quick-developing plunge. But it doesnt have to be perfect to improve your results. It just has to be better than what you would do on your own.
The lower part of this chart shows the Dow Jones Industrial Average total return (blue line) and the same Dow if you had entered and exited using a 200-day MA rule, going all the way back to 1900.
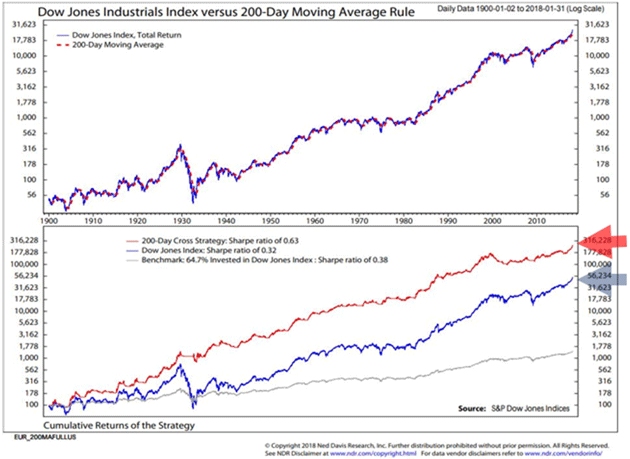
Source: Ned Davis Research
Note this is a log scale so the difference in dollars is even greater than it appears. Better yet, the difference in your mental state would have been incalculable as you missed the major bear markets and then got back in when the uptrend resumed.
Now, there are much more sophisticated versions of this strategy. Some are better than others. But again, I think even something this simplistic is much better than going it alone, particularly in the unprecedented, never-before-seen conditions I anticipate in the 2020s. The one thing we can be pretty sure about is the trends will change periodically, and every such change will be an opportunity for profit or loss.
This year in Dallas I will gather a number of close friends and some very famous and wise investors to talk about those very trends and opportunities.
Each year for the last 15 years at the close of the Strategic Investment Conference I have asked myself, Can it get any better than this? And each year it has. And this year will not be an exception.
Look at the lineup that will join me May 1316 in Dallas: former president George W. Bush, Howard Marks of Oaktree Capital, Felix Zulauf, Carmen Reinhart, Jeffrey Sherman of DoubleLine, Louis Gave, Grant Williams, George Friedman, David Rosenberg, Lacy Hunt, and the inimitable Bill White. We just confirmed Liz Ann Sonders, the chief investment strategist for Schwab, along with data maven Peter Boockvar. Neil Howe and Pat Caddell will talk about demographics and politics in 2020. Plus more A-list speakers you can see on the website.
Conferences are my personal artform. I literally handpick and then craft an agenda that builds on itself. Youll leave with specific investment ideas and an understanding of the world that you cant get anywhere else. We cover geopolitical events, financial markets, housing, energy, market cycles, China, Europe, global and corporate debt, and more. This year there will be more interaction on the stage than ever between the speakers.
The biggest compliment I get? Not just the people telling me that it was the best conference they have ever attended, but over two-thirds of attendees have been to more than one conference. Many have been to more than five. There is a contingent of Aussies that comes from down under and has been doing so for many years. They tell me every year its the best ever. Each year the conference grows because attendees come back again and again.
We make sure that you get time to meet with the speakers, ask questions, and most importantly meet your fellow attendees and make lifelong friends. If you can, be there Monday evening to experience one of the exclusive dine-around dinners with speakers.
Right now, you can register at the early-bird discount. That price will go up soon, so dont procrastinate. No other conference anywhere delivers as much information and economic thought power, tailored specifically for you. Join me as we think about the rest of this year and the 2020s beyond.
By the way, when you click on that link, scroll down a bit and watch the short video where I try to describe what a Strategic Investment Conference experience really is.
Im finishing this letter in Boca Raton, where I am speaking for the Tiger 21 conference. It has been an enjoyable time with many friends. Shane and I fly home to Puerto Rico tomorrow (it still seems odd to say that), and then back to Dallas later in February.
In March I will get my fair share of visiting the city of Cleveland. I have to go back-to-back weeks for eye surgery/cataract lens replacement, since the doctor doesnt want to do both eyes on the same day, then again for a checkup. I may work in some media and small investor group meetings, if theyre just one flight away from Cleveland.
Its time for the next conference session, so I will hit the send button. You have a great week!
Your trying to understand the cycles analyst,
John Mauldin
Chairman, Mauldin Economics |


