-- Published: Sunday, 17 March 2019 | Print | Disqus
Theories and Realities
Valuation Matters
Why Average Rarely Happens
New York, Cleveland, Austin, and Dallas
Last week, I described the enormous challenges retirees face. One reason for that, aside from insufficient savings, is that markets havent delivered the returns many experts said we could plan on.
Back in the late 1990s, we were told that the long-term average return (~10%) was a reasonable long-term assumptioneven if the market cooled down from the tech boom. Instead, the S&P 500 index gained about 3% annually since 1999 with total return just over half of the historical average. As a result, Baby Boomers are having towork longer and harder to retire, as well as save more of their income.
Nonetheless, hope still springs eternal for historically average returns. In this weeks letter, longtime friend Ed Easterling joins me as co-author to explore the reasons that so many analysts and product purveyors pitch such hopeful expectations. (Longtime readers will know Ed and I do this periodically.) Well show how the long-term average is a longshot bet in almost any market environment. Most of the time, returns over a decade or two are well-above or well-below average.
Most of all, its fairly predictable which side of average will occur. This has serious implications, yet theres a lot that you can do to still achieve investment success. This is also something you will not hear from many in the investment business. Predicting less than historical average returns in the future is not exactly a great sales pitch. But as I think Ed and I will demonstrate, it is the most honest and accurate way to talk about potential performance of the future.
Ed founded Crestmont Research in 2001 to research and explain secular stock market cycles. You can find a treasure trove of fabulous charts and articles on cycles and market returns at hiswww.CrestmontResearch.comwebsite. Im a big fan of Eds work and highly recommend both of his books, especiallyUnexpected Returns.
Before we jump in, let me quickly remind you that registration for the Strategic Investment Conference (May 1316 in Dallas) closesSaturday night, March 16.As of now, we still have a few seats left, but they are going fast. We will start a waiting list when they are gone.Click here to registeror add yourself to the waiting list.
I have finally rounded out the list of speakers. In addition to those previously announced, weve added former Secretary of Energy Spencer Abraham, intrepid investor Kyle Bass, and Dr. Woody Brock. This rounds out the most exciting speaker lineup of the last 16 years. You really want to be in the room with me. The China panel will be nothing short of amazing. There will be a very powerful energy panel. We will be focusing on how the world responds to ever-growing debt and government obligations, both real and unfunded. Well discuss geopolitics, political and social change, great investments and the future of the markets. I have asked some experts, some you know of and some you dont, to join us. And as always, well have special sessions focused on a particularly powerful investment theme. The SIC will get your mind looking at the world from different perspectives.
This is going to be the biggest and best Strategic Investment Conference we have ever done. Besides being incredibly packed with powerful ideas, its also going to be really fun.Be there. Now on to todays letter.
No Free Lunch: Return Is Determined by Valuation
By John Mauldin and Ed Easterling
A famous Greek myth involves Orion and Scorpius, whose struggle became eternal after Zeus banished them to opposite fields of the night sky. During winter, Orion hunts in the evening. Yet when summer returns, Scorpius owns the heavens.
The stock market has its own perpetual mythologies. Every investor and financial advisor understands that past performance is not indicative of future results. Yet for passive stock portfolios, many embrace century-long averages of stock market performance as a reasonable assumption for future returns.
In reality, the market has periods when Orion finds a bounty of returns, and volatile, low-return periods when Scorpius rules. Investors must know whether the stock markets season is summer or winter in order to select the best securities and strategies.
In 1952, theJournal of Financepublished a paper written by Dr. Harry Markowitz titled Portfolio Selection. He wrote it while still a graduate student, and it introduced the concepts known today as Modern Portfolio Theory (MPT).
Markowitz likely knew that MPT posed great risk to investors should his magnum opus fall into the wrong hands. He carefully included a warning label in the first paragraph:
The process of selecting a portfolio may be divided into two stages. The first stage starts with observation and experience and ends with beliefs about the future performances of available securities. The second stage starts with the relevant beliefs about future performances and ends with the choice of portfolio. This paper is concerned with the second stage.
Unfortunately, the warning has been largely ignored. Maybe he should have been clearer:
Do not use MPT withoutrelevantbeliefs for future performance!
The rest of Markowitzs paper details how risk drives return. He describes how to construct diversified portfolios that optimize returns for a desired level of risk. The level of return, however, is whatever the market delivers. Thats why the precursor stage to MPT is so important. MPT and related models have been used for many decades to build portfolios for individual and institutional investors.
Dr. Eugene Fama later amplified this idea with a paper explaining the Efficient Market Hypothesis. In summary, Fama said markets are extremely efficient at pricing stocks. As a result, after you make numerous assumptions (which basically assume away the real world), investment analysis and selection adds no further value.
Within a few years (1973), professor and economist Burton Malkiel published his literary classic:A Random Walk Down Wall Street. Across its 456 pages, Dr. Malkiel reinforces the message that the stock market follows a random path. As a result, investors are helpless and shouldnt try to beat it.
Once those three messages went mainstream, the essential ingredients for investor helplessness were in place. Risk drives return. Markets are efficient. Returns are random. Why try? Investors should simply buy and hold. The three professors just needed a bull market to indelibly reinforce the message.
By the time the Great Secular Bull of the 1980s and 1990s ended, index mutual funds had become a highly popular form of stock ownership. Technology then made possible an even more efficient successor: the exchange traded fund (ETF).
Over these decades, millions of investors embraced passive buy-and-hold investing, believing they could simply ride the market and achieve long-term success. Investors and investment professionals became intoxicated rather than alarmed when actual performance greatly exceeded the assumed 10% long-term average return. Surveys in the early 2000s showed investors expecting 15% annual returns for years to come.
That was easy to believe at the time because conditions were perfect. The initially low and progressively rising valuation level of the stock market provided a fertile environment for buy-and-hold. But now we know what happened.
Large segments of the financial industry still believe valuation doesnt matter. For example, mistaken notions of randomness and consistent long-term returns lead investors to expect the same long-term return from peaks like 2000 and 2007 as they expect from troughs like 2002 and 2009. Clearly, these are instances when theory and reality diverge.
Markowitz advised us to use relevant assumptions. To assess relevance and reasonableness, lets consider a period long enough to smooth short-term fluctuations, yet not so long that an investor loses the opportunity to adjust expectations, lifestyle, savings rate, etc. For most investors, that period is a decade or two. If you are age 55 or over, 20 years starts to sound like the long run.
As previously mentioned, the stock markets nominal long-term annualized total return has been around 10%. Total return includes capital gains as well as dividends. The century-long 10% average is also close to the average annualized return across all 110 decade-long periods since 1900 (i.e., 19001909, 19011910, etc.). Yet none of those decades delivered exactly 10%.
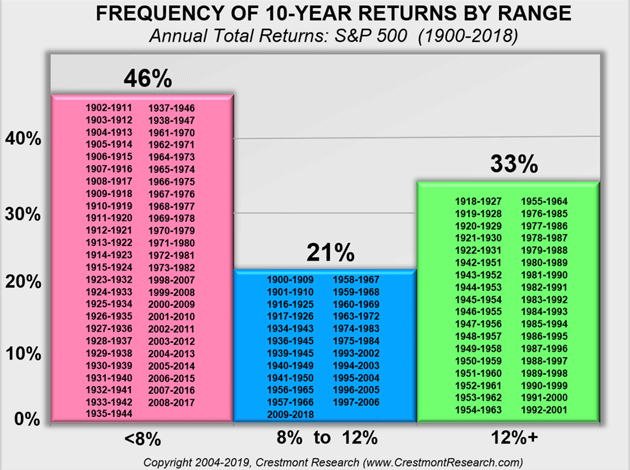
To assess the reasonableness of using 10% as an assumption for future annualized returns, a range is more relevant than a single value. If a high percentage of the decades fall near the average, then it would be reasonable to assume that average is relevant and has a reasonable likelihood of occurring. However, if near-average is rare, then such an assumption would be foolish.
To be generous to the analysis, lets say 8% to 12% represent a near-average range. Although 8% and 12% deliver quite different long-term return results, our purpose here is just to assess credibility.
As shown below, only 21% of the decade-long periods since 1900 delivered annualized total return from the S&P 500 Index between 8% and 12%, and strikingly few were close to the 10% average. Only about one-third of the periods showed a compounded rate over 12%. Almost half of the periods showed less than 8% annual returns!
With almost 80% of the decade-long periods not near-average, using 10% as a relevant assumption for the next decade or two is a long-shot bet. For investors patient enough to evaluate twenty-year periods, the incidence of near-average values between 8% and 12% increases to 35%. Thus, the odds-on betat least two-thirds of the timeis to assume nowhere close to 10%.
Taking the analysis of decade-long periods a step further, lets explore the effect of relative valuation on returns. Stock market valuation is most often measured with the price/earnings ratio (P/E).
Across the 110 decade-long periods, total return for the S&P 500 Index ranged from an annualized loss of almost -2% to an annualized gain of just under 20%. Even a ten-year period wasnt enough to ensure a gain. Four of the decade-long periods delivered losses, and even more when inflation is taken into account.
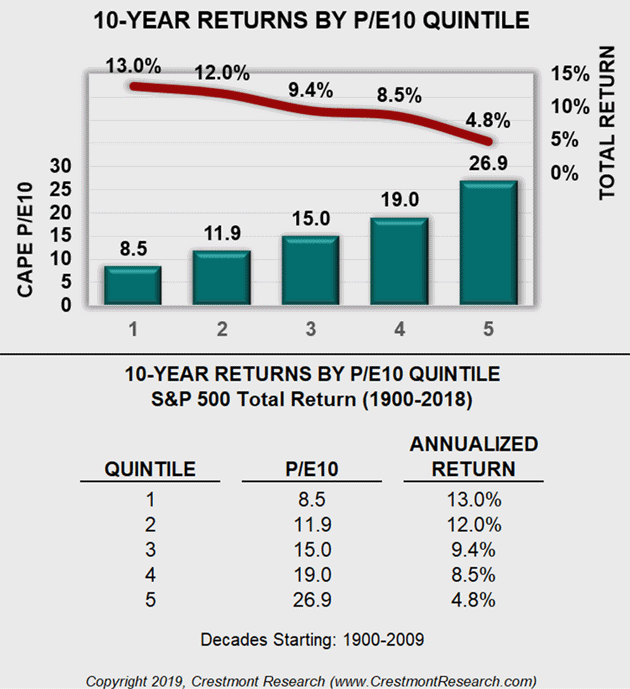
The next chart divides the series into five quintiles, each with twenty-two of the decades. The first quintile includes the twenty-two periods with the lowest starting value for P/E. The second quintile has the next lowest set and the fifth quintile includes the decades starting with the highest P/E values.
The graph and table present the average value for P/E in each of the quintiles as well as the corresponding average annualized total return. As the markets valuation level rises, the level of return realized from the stock market declines.
For example, the average P/E for the lowest twenty-two decades is 8.5 and the average compounded annualized return is 13.5%. The average P/E across the highest twenty-two periods is 26.9, with return averaging 4.8%. As beginning P/E rises, the subsequent return slides.
There is some variation and occasional outliers within these quintiles. For example, some periods start with high valuation and end with even higher valuation (e.g., 1995). In other instances (e.g., 1974), relatively low valuation was even lower ten years later. Bull market and bear market cycles run for various lengths. But when assessed in the aggregate, the relationship of valuation and subsequent return is strong. A higher valuation is strongly associated with diminished returns over the next 1020 years.
This is intriguing because the results are counterintuitive. It raises a question about whether either or both of the extremes might be predictable. Is there a way to know at the start of the ten-year period whether its likely to deliver above-average or below-average returns?
The quintiles provide a hint to the underlying cause, but dont provide all of the answers. It also doesnt address whether the relationship of valuation and return is simple correlation or is causal. These answers and insights could significantly impact an investors decision about the most appropriate investment approach. It would even provide buy-and-hold investors with a better expectation for their likely outcome.
Malkiel was right about the stock market being random, but only in the short term. The day-to-day fluctuations are responses to new information and changing investor psychology. These daily adjustments are part of the process that Fama described in his theory about market efficiency.
Both men, however, were mistaken about timing. Malkiel asserted that even long-term returns walk randomly. He seems to have thought that something random in the short run must be even harder to predict over the long run.
Ironically, the short term is burdened with noise that the longer term filters out. Benjamin Graham, the father of value investing, described this dynamic with the metaphor: In the short run, the market is a voting machine. But in the long run, it is a weighing machine.
Likewise, Fama assumed that market efficiency worked at the speed of a trade. In reality, theres a lot of information and different views about the same information to process into market prices. Market efficiency is an extended process; its not an immediate event. Individual stock analysis and selection are part of this efficiency process.
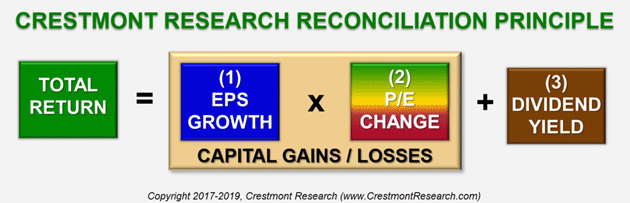
Stock market return is more than a single number tucked in front of a percent sign. Three components underly stock market return: earnings growth rate, dividend yield, and the change in valuation level over the period (i.e., P/E).
Earnings growth pairs with valuation change to drive capital gains or losses. If the markets P/E remains constant, the index will rise or fall equal to changes in aggregate earnings. Likewise, if earnings dont change, the index will increase or decrease with changes in P/E. Dividend yield is the proverbial icing on the cake that completes total return.
Above, we made a compelling case for the relationship between P/E and return. The primary determinant of whether a decade ends in the pink or green bar is the change in P/E over the respective period. P/E tends to fluctuate in a bounded range generally between 10 and 25, yet rarely below 8 or above 30.
As basic as it may sound, returns tend to be higher when P/E starts low. Likewise, losses are more likely when P/E starts high. Therefore, almost all of the periods in the below-average pink bar started with P/E above the historical average. Similarly, almost all of the periods in the above-average green bar started with a relatively low P/E.
Most importantly, changes in P/E over longer-term periods are not random. Although in the short run, investor psychology and current events push P/E above or below its fair value, the change in valuation level over the long term is driven by financial principles.
Valuation rises and falls to adjust the general level of return from stocks, which fluctuates in response to changes in the inflation rate. For example, when inflation rises, financial securities respond with lower valuation to compensate for the costly effects of inflation.
Most financial assets, especially stocks, rise toward their highest relative value (and lowest expected return) when the inflation rate is low and stable. Bond prices rise as yields fall in response to declining inflation. Stocks, as perpetual securities, react positively to low inflation. Therefore, the P/E cycle is primarily a response to the inflation cycle. Over the long run, P/E is driven by fundamentals, not by randomness.
* * * * * * *
John here to close: P/E is even more powerful than its multiplier effect on earnings. But well need to save that discussion until next week. It will lead us into a talk about market valuation (fairly priced or overvalued), implications for predicting returns (yes, it is possible), and a few thoughts on investment approach. You wont want to miss it. Ill have more surprising and insightful charts from Ed and Crestmont Research.
Shane and I are in Cleveland as I finish this letter. Well fly to New York for the weekend to see a Broadway show and meet with friends, then a business meeting on Monday morning and back to Cleveland.
Dr. Rockwood removed the cataract from my left eye on Wednesday, liked what he saw the next day, and scheduled surgery for my right eye next Wednesday. I will be in Austin and Dallas the first week of April for investor meetings that I am told are already full. Then we will fly back to Puerto Rico until the end of the month, where Chicago seems to be appearing on my calendar.
We mentioned Harry Markowitz and Burt Malkiel. I have met both separately and together on more than a few occasions, primarily at Robb Arnotts invitation. They are delightful people and deserve the accolades they have had. Harry is 91 and although moving slower, his mind is as wicked sharp as ever. It still fills me with awe to remember him lecturing me as I challenged a particular point of MPT at a conference in Florida at least 15 years ago. He drew quadratic equations in the air (I swear this is true) to explain my obvious lack of understanding. I am not sure what he said because I was simply awestruck as he was drawing those quadratic equations in reverse so that I could see them. I was so overwhelmed with even the concept of doing that, I completely lost track of what he was saying. My life has been blessed to get to meet so many people like Harry. I have learned a lot from our walks and quiet conversations overlooking pleasant venues.
Back in the real world, I have been told to avoid strenuous activity while my new eyes get settled. Which means more reading and walking. Have a great week and spend some time with friends.
Your thinking returns will be below-average in the next 10 years analyst,
John Mauldin Chairman,Mauldin Economics
Thoughts From the Frontlineand MauldinEconomics.com is not an offering for any investment. It represents only the opinions of John Mauldin and those that he interviews. Any views expressed are provided for information purposes only and should not be construed in any way as an offer, an endorsement, or inducement to invest and is not in any way a testimony of, or associated with, Mauldin's other firms. John Mauldin is the Chairman of Mauldin Economics, LLC. He also is the registered Principle of Mauldin Securities, LLC, aFINRAandSIPC, registered broker-dealer. Mauldin Securities LLC is registered with the NFA/CFTC, as an Introducing Broker (IB) and Commodity Trading Advisor (CTA).
John Mauldin, Chief Economist and Investment Advisor Representative, CMG Capital Management Group, LLC, provides investment management services through its affiliated mutual fund, the CMG Mauldin Solutions Core Fund (the Fund), a series of Northern Lights Fund Trust, an investment company registered under the Investment Company Act of 1940. CMG receives a management fee as the investment manager to the Fund a portion of which is paid to John Mauldin.. A complete description of the Fund, its strategy, objectives, and costs is set forth in the Fund prospectus, a copy of which is provided to all clients that engage the Registrants services through the Fund.
This message may contain information that is confidential or privileged and is intended only for the individual or entity named above and does not constitute an offer for or advice about any alternative investment product. Such advice can only be made when accompanied by a prospectus or similar offering document. Past performance is not indicative of future performance. Please make sure to review important disclosures at the end of each article. Mauldin companies may have a marketing relationship with products and services mentioned in this letter for a fee.
PAST RESULTS ARE NOT INDICATIVE OF FUTURE RESULTS. THERE IS RISK OF LOSS AS WELL AS THE OPPORTUNITY FOR GAIN WHEN INVESTING IN MANAGED FUNDS. WHEN CONSIDERING ALTERNATIVE INVESTMENTS, INCLUDING HEDGE FUNDS, YOU SHOULD CONSIDER VARIOUS RISKS INCLUDING THE FACT THAT SOME PRODUCTS: OFTEN ENGAGE IN LEVERAGING AND OTHER SPECULATIVE INVESTMENT PRACTICES THAT MAY INCREASE THE RISK OF INVESTMENT LOSS, CAN BE ILLIQUID, ARE NOT REQUIRED TO PROVIDE PERIODIC PRICING OR VALUATION INFORMATION TO INVESTORS, MAY INVOLVE COMPLEX TAX STRUCTURES AND DELAYS IN DISTRIBUTING IMPORTANT TAX INFORMATION, ARE NOT SUBJECT TO THE SAME REGULATORY REQUIREMENTS AS MUTUAL FUNDS, OFTEN CHARGE HIGH FEES, AND IN MANY CASES THE UNDERLYING INVESTMENTS ARE NOT TRANSPARENT AND ARE KNOWN ONLY TO THE INVESTMENT MANAGER. Alternative investment performance can be volatile. An investor could lose all or a substantial amount of his or her investment. Often, alternative investment fund and account managers have total trading authority over their funds or accounts; the use of a single advisor applying generally similar trading programs could mean lack of diversification and, consequently, higher risk. There is often no secondary market for an investor's interest in alternative investments, and none is expected to develop. You are advised to discuss with your financial advisers your investment options and whether any investment is suitable for your specific needs prior to making any investments.
All material presented herein is believed to be reliable but we cannot attest to its accuracy. Opinions expressed in these reports may change without prior notice. John Mauldin and/or the staffs may or may not have investments in any funds cited above as well as economic interest. John Mauldin can be reached at 800-829-7273.
The content on this site is protected
by U.S. and international copyright laws and is the property of GoldSeek.com
and/or the providers of the content under license. By "content" we mean any
information, mode of expression, or other materials and services found on GoldSeek.com.
This includes editorials, news, our writings, graphics, and any and all other
features found on the site. Please contact
us for any further information.
Live GoldSeek Visitor Map | Disclaimer
The views contained here may not represent the views of GoldSeek.com, Gold Seek LLC, its affiliates or advertisers. GoldSeek.com, Gold Seek LLC makes no representation, warranty or guarantee as to the accuracy
or completeness of the information (including news, editorials, prices, statistics,
analyses and the like) provided through its service. Any copying, reproduction
and/or redistribution of any of the documents, data, content or materials contained
on or within this website, without the express written consent of GoldSeek.com, Gold Seek LLC,
is strictly prohibited. In no event shall GoldSeek.com, Gold Seek LLC or its affiliates be
liable to any person for any decision made or action taken in reliance upon
the information provided herein.