-- Published: Monday, 18 April 2016 | Print | Disqus
After finishing its best quarter in 30 years, gold extended its gains, rising more than 17.2 percent year-to-date to become the best performing asset class among other commodities, U.S. Treasury bonds and major world currencies and equity indices.
We are likely entering a new gold bull market, writes the World Gold Council (WGC). If so, it would be the first time since the previous one concluded in September 2011, when the metal reached its all-time high of $1,900 per ounce. Since 1970, weve seen five gold bull markets, each one lasting an average 63 months and returning an average 385 percent, according to the WGC.
Now, as reported on Mining.com, one precious metals analyst predicts gold could rise to $3,000 within the next three years. Speaking at the Dubai Precious Metals Conference this week, Dr. Diego Parrilla, coauthor of the book The Energy World Is Flat, stated that a perfect storm for gold is brewing as uncertainty over global central bank policies is deepening. We might have reached the limit of what quantitative easing (QE) programs and negative interest rate policies (NIRP) can accomplish.
Three thousand dollars might be an overstatement, but several prominent financial institutions, including HSBC, RBC Capital Markets and Credit Suisse, are currently bullish on the metal.
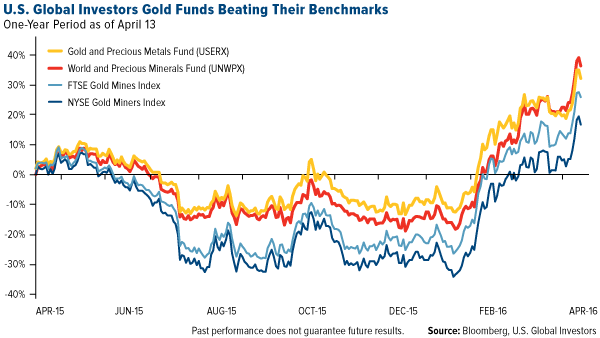
For the 12-month period as of April 13, our Gold and Precious Metals Fund (USERX) was up 31.96 percent, while the World Precious Minerals Fund (UNWPX) returned 36.34 percent. This puts us ahead of the funds two benchmarks, the FTSE Gold Mines Index and NYSE Gold Miners Index.
Im also pleased to say that as of March 31, USERX continues to hold its overall four-star rating from Morningstar among 71 Equity Precious Metals funds, based on risk-adjusted returns.
Drivers of Gold: The U.S. Dollar and Real Interest Rates
The U.S. dollar has been weakening relative to other major currencies, recently hitting an 11-month low of 94.06, down 4.8 percent year-to-date. Gold is priced in dollars, so when the greenback drops, the yellow metal becomes less expensive, and therefore more attractive, for buyers in other countries.
More meaningful to price movements, however, are negative real interest rates. When inflation picks up, making short-term government bond yields drop below zero percent, savvy investors turn to other so-called haven assets, gold among them. This is what I call the Fear Trade. In September 2011, when gold hit $1,900, the real fed funds rate was sitting close to negative 4 percent.
Zero Hedge found that since 2008, the correlation between gold prices and real negative rates has been particularly high, adding:
Based on a regression analysis holding gold as the independent variable, a negative 0.5 percent real rate level would suggest a gold price of $1,380 an ounce and a negative 1.0 real rate level would suggest a gold price of $1,546 an ounce
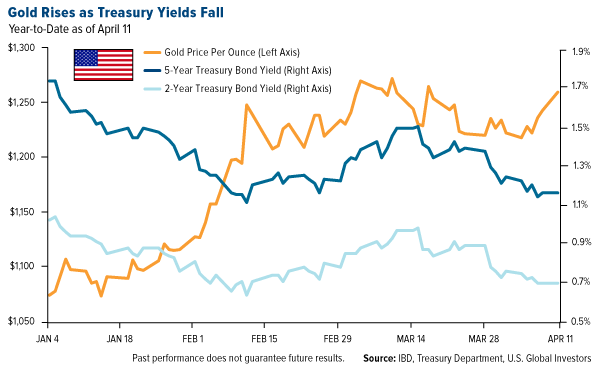
The potential for inflation rates to move upwards and match U.S. Treasury yields, which continue to be held down in the short-term, could create a 1970s-esque phase in real rates.
There were two gold bull markets in the 1970s, according to the WGC. The first, which lasted from January 1970 to January 1975, returned a cumulative 451 percent. The second, lasting from October 1976 to February 1980, gained a whopping 721 percent.
As of April 11, the 2-year Treasury yield has contracted 93 percent in 2016, the 5-year yield more than 32 percent. This doesnt take inflation into account, which takes a further 2.2 percent from these yields, based on the most recent consumer price index (CPI) reading.
Interested in taking a deeper dive into gold? On May 10, Ill be speaking at the 35th annual MoneyShow conference, which will be held this year at Caesars Palace in Las Vegas. Registration is absolutely free. I hope to see you there!
Please consider carefully a funds investment objectives, risks, charges and expenses. For this and other important information, obtain a fund prospectus by visiting www.usfunds.com or by calling 1-800-US-FUNDS (1-800-873-8637). Read it carefully before investing. Foreside Fund Services, LLC, Distributor. U.S. Global Investors is the investment adviser.
Past performance does not guarantee future results.
Total Annualized Returns as of 3/31/2016:
Fund | One-Year | Five-Year | Ten-Year | Gross Expense Ratio | Expense Cap |
Gold and Precious Metals Fund | 24.07% | -16.32% | -3.02% | 1.97% | 1.90% |
World Precious Minerals Fund | 26.49% | -21.56% | -6.62% | 1.99% | 1.90% |
FTSE Gold Mines Index | 20.65% | 17.69% | -4.42 | n/a | n/a |
NYSE Arca Gold Miners Index | 11.02% | -18.60 | -5.21 | n/a | n/a |
Expense ratios as stated in the most recent prospectus. The expense cap is a voluntary limit on total fund operating expenses (exclusive of any acquired fund fees and expenses, performance fees, extraordinary expenses, taxes, brokerage commissions and interest) that U.S. Global Investors, Inc. can modify or terminate at any time, which may lower a funds yield or return. Performance data quoted above is historical. Past performance is no guarantee of future results. Results reflect the reinvestment of dividends and other earnings. For a portion of periods, the fund had expense limitations, without which returns would have been lower. Current performance may be higher or lower than the performance data quoted. The principal value and investment return of an investment will fluctuate so that your shares, when redeemed, may be worth more or less than their original cost. Performance does not include the effect of any direct fees described in the funds prospectus (e.g., short-term trading fees of 0.05%) which, if applicable, would lower your total returns. Performance quoted for periods of one year or less is cumulative and not annualized. Obtain performance data current to the most recent month-end at www.usfunds.com or 1-800-US-FUNDS.
4 Stars | Overall/71 |
4 Stars | 3-Year/71 |
4 Stars | 5-Year/70 |
4 Stars | 10-Year/50 |
Morningstar ratings based on risk-adjusted return and number of funds
Category: Equity Precious Metals
Through: 3/31/2016
Morningstar Ratings are based on risk-adjusted return. The Morningstar Rating for a fund is derived from a weighted-average of the performance figures associated with its three-, five- and ten-year (if applicable) Morningstar Rating metrics. Past performance does not guarantee future results. For each fund with at least a three-year history, Morningstar calculates a Morningstar Ratingä based on a Morningstar Risk-Adjusted Return measure that accounts for variation in a funds monthly performance (including the effects of sales charges, loads, and redemption fees), placing more emphasis on downward variations and rewarding consistent performance. The top 10% of funds in each category receive 5 stars, the next 22.5% receive 4 stars, the next 35% receive 3 stars, the next 22.5% receive 2 stars and the bottom 10% receive 1 star. (Each share class is counted as a fraction of one fund within this scale and rated separately, which may cause slight variations in the distribution percentages.)
Gold, precious metals, and precious minerals funds may be susceptible to adverse economic, political or regulatory developments due to concentrating in a single theme. The prices of gold, precious metals, and precious minerals are subject to substantial price fluctuations over short periods of time and may be affected by unpredicted international monetary and political policies. We suggest investing no more than 5% to 10% of your portfolio in these sectors.
Note that gold stocks, gold bullion and Treasury bonds differ in investment objectives, costs and expenses, liquidity, safety, guarantees or insurance, fluctuation of principal or return, and tax features. Treasury bonds are backed by the full faith and credit of the U.S. government.
The FTSE Gold Mines Index Series encompasses all gold mining companies that have a sustainable and attributable gold production of at least 300,000 ounces a year, and that derive 75% or more of their revenue from mined gold. The NYSE Arca Gold Miners Index (GDM) is a modified market capitalization weighted index comprised of publicly traded companies primarily involved in the mining of gold and silver in locations around the world.
The consumer price index (CPI) is one of the most widely recognized price measures for tracking the price of a market basket of goods and services purchased by individuals. The weights of components are based on consumer spending patterns.
All opinions expressed and data provided are subject to change without notice. Some of these opinions may not be appropriate to every investor. By clicking the link(s) above, you will be directed to a third-party website(s). U.S. Global Investors does not endorse all information supplied by this/these website(s) and is not responsible for its/their content.
| Digg This Article
-- Published: Monday, 18 April 2016 | E-Mail | Print | Source: GoldSeek.com


 Why One Analyst Believes Gold Could Hit $3,000