-- Published: Friday, 8 March 2019 | Print | Disqus

The current stock bull market, already the longest in U.S. history, turns 10 years old this month. It’s been a phenomenally profitable time to participate, especially if you’ve stuck to an investment strategy that favors dividend-paying stocks.
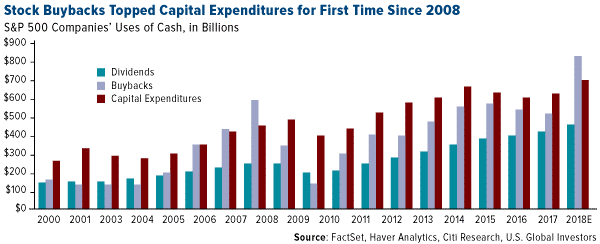
As you can see in the chart below, the amount of cash that S&P 500 Index companies have returned to shareholders has grown each year since 2009. In the final three months of 2018 alone, S&P companies paid out $119.8 billion, a quarterly record. Total dividends for the full year stood at $456.3 billion, up 9 percent from the previous year—another new record.

Thanks to corporate tax reform, stock buybacks also shot up to an all-time high of more than $800 billion in 2018. For the first time since 2008, this amount topped what S&P companies spent to replace or upgrade offices and equipment.
While I’m on this topic, a lot of noise has been made lately about how much companies spent last year repurchasing shares of their own stock. Many critics of President Donald Trump’s tax overhaul suggest that buybacks have been made at the expense of investing and giving workers raises. This is misleading to say the least. Capital expenditures grew substantially from 2017 to 2018—at their fastest pace since 2011, in fact—and often, the same companies that were buying back their stock also increased their investments in their own business and workers.
Moving on…
Buffett Says He’d Buy the S&P Today
For a while now, some financial analysts and pundits have been predicting the end of the business cycle, and the bull market’s 10-year anniversary is only likely to intensify those calls.
The truth is that business cycles do not die from old age alone. In the past, they’ve unraveled as a result of economic shocks, debt crises, wars, changes in monetary policy—but never simply because investors believed they overstayed their welcome.
In other words, I don’t think there’s any reason why this bull run can’t last another 10 years.
Legendary investor Warren Buffett told CNBC just last week that he thinks the aging bull still looks attractive, and if given the choice right now between investing in S&P 500 Index companies and a 10-year bond, he’d go with the former.
“If I had a choice today for a 10-year purchase of a 10-year bond… or buying the S&P 500 and holding it for 10 years, I’d buy the S&P in a second,” Buffett said.
A couple of caveats here: One, you can’t invest directly in an index. And two, Buffett is a billionaire many times over, and so his threshold for risk, even at 88 years old, is probably somewhere in the upper stratosphere.
Be that as it may, there’s research available to support Buffett’s rosy 10-year outlook. Below is a brief excerpt from Oxford Club Chief Income Strategist Marc Lichtenfeld’s 2012 bestseller “Get Rich With Dividends”:
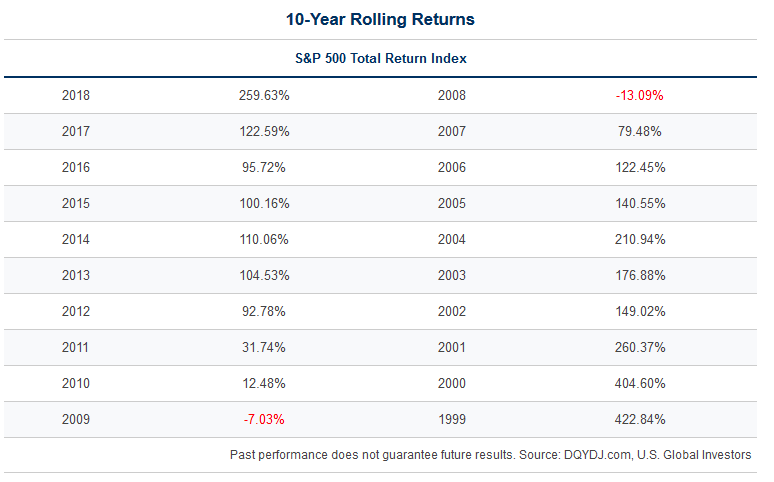
Investing in the stock market works. Since 1937, if you invested in the broad market index, you made money in 69 out of 76 rolling 10-year periods, for a 91 percent win rate. That includes reinvesting dividends.
Past performance does not guarantee future results.
A 91 percent win rate. Put another way, it’s historically been very rare for a portfolio of S&P stocks not to have generated positive returns on a rolling 10-year basis.

According to Marc, only two out of the past 20 years—2008 and 2009—were losers for the 10-year period with dividends reinvested, thanks to the financial crisis. And that’s only if you had cashed out at the worst possible time. Even the tech bubble of the late 1990s and early 2000s wasn’t enough to prevent most investors from losing their principal investments made a decade earlier.
What does all of this mean? It means investors have historically been rewarded when they’ve taken a longer-term outlook and stayed disciplined—and, I might add, focused on companies that were raising their dividends and then reinvested those dividends.
Expecting a Recession? It Might Pay to Stay Invested
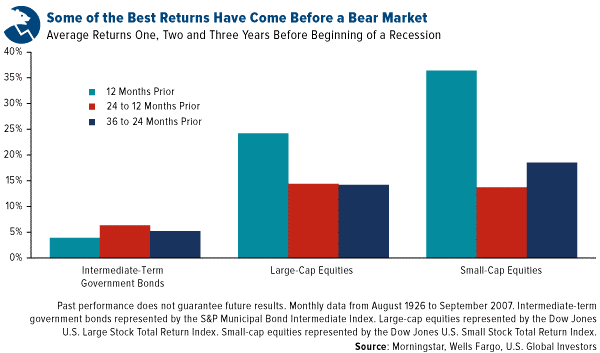
If you believe that a recession or bear market will strike later this year or next, it still might not be time to get out of stocks altogether. That’s because returns have tended to be strongest 12 months or so before the start of a recession, as opposed to two or three years before.
Take a look at the chart below. Based on Morningstar data compiled by Wells Fargo, average returns for large-cap stocks have been highest at almost 25 percent for investors who sold 12 months before an economic downturn. Small-cap stock returns have been even higher at 36.4 percent. In both cases, profits have been much smaller for investors who got out two or three years prior to a recession. As I’ve noted already, past performance is no guarantee of future results.

Also note the returns for intermediate-term government bonds. As you might expect, they were much smaller than those of large-cap or small-cap stocks, no matter when you cashed out. But don’t let that deter you. There’s a place in most people’s portfolios for fixed income, as it can help counter potential equity volatility that has tended to arise late in the business cycle.
Active Management Late in the Cycle
Ten years is a long time, but again, I don’t necessarily think investors should rotate completely out of stocks just yet. I do, however, believe that if you’re going to stay invested, you might want to consider an actively managed fund. Passive ETFs are inexpensive and can give you broad exposure to the U.S. market, but they’re generally not as nimble as a fund managed by an investment professional.
And nimbleness is what you should be seeking if you’re worried about a downturn. Most ETFs rebalance on a quarterly or sometimes monthly basis. That’s perfectly fine for many investors, but if you’re interested in a fund that can respond more quickly to unexpected market hiccups or rallies, an actively managed mutual fund might be a better fit.
--
Stock markets can be volatile and share prices can fluctuate in response to sector-related and other risks as described in the fund prospectus.
All opinions expressed and data provided are subject to change without notice. Some of these opinions may not be appropriate to every investor.
The S&P 500 index is a basket of 500 of the largest U.S. stocks, weighted by market capitalization. The index is widely considered to be the best indicator of how large U.S. stocks are performing on a day-to-day basis. The Total Return Index calculates the results when cash payouts are automatically reinvested. The S&P Municipal Bond Intermediate Index consists of bonds in the S&P Municipal Bond Index with a minimum maturity of 3 years and a maximum maturity of 15 years. The Dow Jones U.S. Large-Cap Total Stock Market Index is a subset of the Dow Jones U.S. Total Stock Market Index, which measures all U.S. equity securities with readily available prices. The index represents the largest 750stocks and is float-adjusted market cap weighted. The Dow Jones U.S. Small-Cap Total Stock Market Index is a subset of the Dow Jones U.S. Total Stock Market Index, which measures all U.S. equity securities with readily available prices. The index represents the stocks ranked 751-2,500 by full market capitalization and is float-adjusted market cap weighted.
There is no guarantee that the issuers of any securities will declare dividends in the future or that, if declared, will remain at current levels or increase over time.
U.S. Global Investors, Inc. is an investment adviser registered with the Securities and Exchange Commission ("SEC"). This does not mean that we are sponsored, recommended, or approved by the SEC, or that our abilities or qualifications in any respect have been passed upon by the SEC or any officer of the SEC. This commentary should not be considered a solicitation or offering of any investment product. Certain materials in this commentary may contain dated information. The information provided was current at the time of publication.
| Digg This Article
-- Published: Friday, 8 March 2019 | E-Mail | Print | Source: GoldSeek.com

