-- Published: Tuesday, 14 May 2019 | Print | Disqus
Before we get to looking at those three charts, lets talk about the trade war. On Friday the Trump administration made good on its threat to raise tariffs on as much as $200 billion worth of Chinese imports to 25 percent from the previous 10 percent. The president also said that a decision could be made soon on whether to impose the same 25 percent rate on an additional $325 billion of Chinese goods, which, all told, would cover approximately the total amount of goods the U.S. imported from China in 2018.
So what does this mean? Besides being a strain on international relationsa tariff is essentially a tax that must be paid to the U.S. government before a shipment can clear customs. But heres the kicker: Tariffs are typically paid not by the exporting company but by the importer. In other words, its U.S.-based companies that are picking up the tabthen passing the extra expense on to American consumers.
With the exception of the U.S. Treasury, which collects the tariff payments, few stand to benefit here. A February study by Washington, D.C.-based Trade Partnership Worldwide (TPW) estimated that 25 percent tariffs on Chinese goods cost families of four close to $2,300 extra on average per year. They also have the potential to impact upwards of 2.2 million American jobs as well as risk diverting trade to other markets.
By any measure, the imposition of tariffs by the United States and U.S. imports of steel, aluminum, motor vehicles and parts
is a net loss for the U.S. economy and U.S. workers, the report reads. Workers experience greater losses than gains, and in many cases, according to TPW, the tariff actions erase all of the anticipated gains from tax reform.
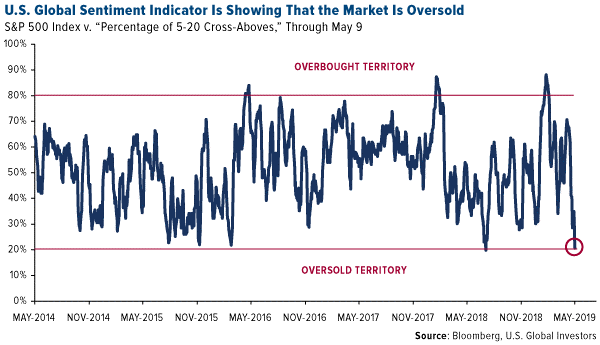
Market Sentiment at Its Lowest in 10 Months
Stocks sold off last week on the tariff news and plunged even further Monday after China announced that it would retaliate.
Equities are now officially in oversold territory. Our own U.S. Global Sentiment Indicator, which tracks as many as 126 commodities, indices, sectors, currencies and international markets, calculates the percentage of positions whose five-day moving averages are above or below their 20-day moving averages. Then we compare the data to the S&P 500 Index. Last week the sentiment indicator fell to 20 percent, showing that the market is at its most oversold since July 2018. Statistically, we should expect to see a bounce.
Stocks may still have further to slide before a resolution to the trade dispute is reached. But for now this could be a good opportunity for investors to pick up some distressed stocks as we await mean reversion. I recommend that investors who seek to get access to the robust U.S. economy but limit their exposure to international trade would do well to look at high-quality small and mid-cap equities. Smaller firms, those with market caps between $1 billion and $10 billion, have the potential to outperform right now because they rely much less on trade than their larger multinational peers. Theyre also supported by a stronger U.S. dollar.
I would also recommend considering government and investment-grade municipal bonds, which historically have helped investors improve their risk-adjusted returns in times of economic uncertainty. And of course theres always exposure to gold and other metals that are expected to be in greater demand in the coming years, copper chief among them.
This leads us to the main event. Below are three charts that I think will convince investors that time is running out to prepare for the next major downturn. All charts and data were brought to my attention by Michael Kantrowitz, head of portfolio strategy at market research firm Cornerstone Macro, who visited our office last week.
1. Is U.S. Manufacturing Growth Projected to Stall?
The ISM Manufacturing Index for the U.S. fell sharply in April to 52.8, down from 55.3 in March. This means that although the manufacturing sector is still expanding, its doing so at a much slower pace. Whats more, the manufacturing index could soon fall below 50.0, indicating a slowdown. For this wed largely have the Federal Reserve to thank.
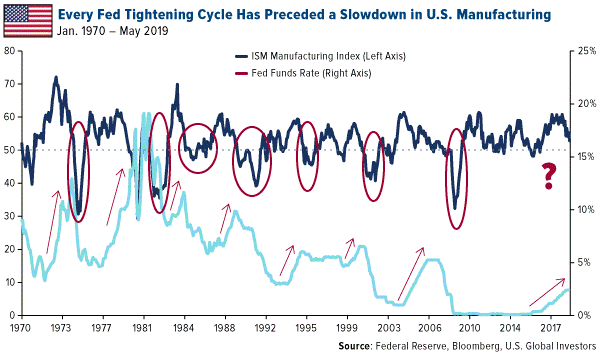
Thats according to Michael, who pointed out to us that every Fed tightening cycle going back to the 1950s has preceded a pullback in the ISM Manufacturing Index. And each of these pullbacks coincided with an economic recession and/or market selloff. (One notable exception was 1995, when the market continued to rally despite manufacturing weakness.)
So will this time be different?
Ill let my friend Bob Moriartywhose excellent book Basic Investing in Resource Stocks I reviewed earlier this monthtackle this one: The most dangerous words in investing are This time its different. Its never different.
2. Trying to Predict Future Earnings Per Share Growth? Monitor Lumber Prices
One of the most eye-opening charts Michael shared illustrates the close relationship between lumber prices and future earnings per share (EPS) growth. Believe it or not, he told us, lumber prices are among the most reliable leading indicators available.
I believe it. Housing is a massive part of the U.S. economy, contributing between 15 percent and 18 percent to gross domestic product (GDP), according to the National Association of Home Builders (NAHB). Housing also has an extremely high multiplier effect. Every 100 homes in the U.S. can support up to 70 jobs on average and generate as much as $4.1 million in local income on an ongoing annual basis.
So it stands to reason that lumber prices can give us an incredibly accurate forecast of where the market is headed. In the chart below, lumber prices have been advanced forward six months to illustrate the lag time between changes in price and EPS estimates. When lumber tanked over the 12-month period, EPS followed around six months later. And when lumber soared, EPS estimates shot up.
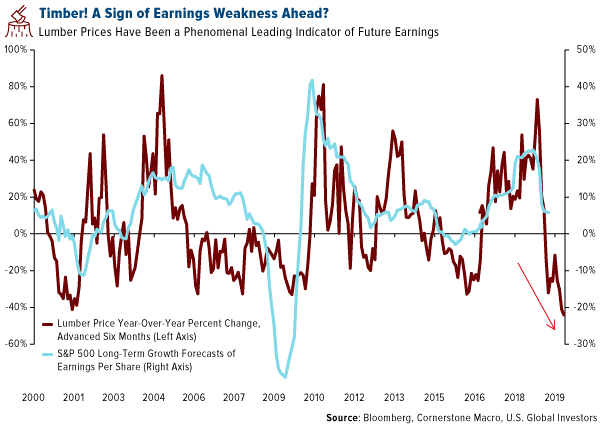
You may have already detected the warning signal that lumbers flashing right now. From its high in May of last year, the lumber price has plunged almost 50 percent. Thats the commoditys sharpest 12-month decline on record. Going forward, then, keep your eyes on earnings, which are a central driver of stock prices.
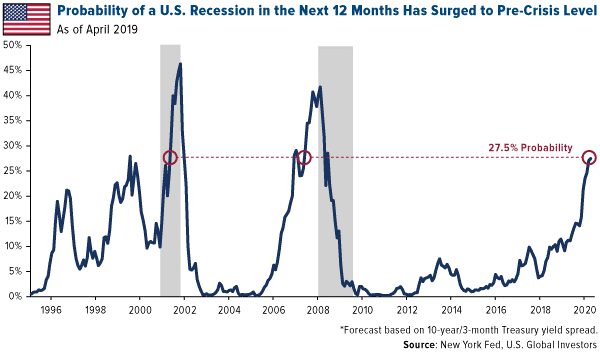
3. New York Fed on Recession Watch
Every month, the New York Fed updates its probability of an economic recession in the next 12 months. Probabilities are calculated using the spread between the 10-year and three-month Treasury yieldwhich inverted again last week for the first time since March.
According to the Feds most recent report, the probability that a recession will make landfall between now and April 2020 rose to 27.49 percent, its highest reading since January 2007 (as it was ascending, not falling), and before that, September 1999.
Past performance does not guarantee future results, of course, but the point Im trying to make by sharing these charts is that it might be time to consider making some adjustments to your portfolio. That doesnt mean rotating entirely into safe havens, especially since the market is so oversold right now.
When Picking Gold Stocks, Be Sure to Focus on Quality
But if youre concerned about what the data suggests, it might be prudent to ensure you have exposure to fixed income, specifically tax-free muni bonds, as well as gold and gold stocks. One of our favorite gold names, Franco-Nevada, just reported record net revenue of $179.8 million and record net income of $65.2 million in the March quarter. But when selecting gold stocks, its important to stick with quality companies that have competent management, little to no debt and a portfolio of high-grade mines. Go gold!
--
All opinions expressed and data provided are subject to change without notice. Some of these opinions may not be appropriate to every investor. By clicking the link(s) above, you will be directed to a third-party website(s). U.S. Global Investors does not endorse all information supplied by this/these website(s) and is not responsible for its/their content.
The ISM manufacturing composite index is a diffusion index calculated from five of the eight sub-components of a monthly survey of purchasing managers at roughly 300 manufacturing firms from 21 industries in all 50 states. The S&P 500 Stock Index is a widely recognized capitalization-weighted index of 500 common stock prices in U.S. companies. Mean reversion is a theory used in finance that suggests that asset prices and historical returns eventually return back to the long-run mean or average level of the entire data set.
Holdings may change daily. Holdings are reported as of the most recent quarter-end. The following securities mentioned in the article were held by one or more accounts managed by U.S. Global Investors as of 3/31/2019: Franco-Nevada Corp.
U.S. Global Investors, Inc. is an investment adviser registered with the Securities and Exchange Commission ("SEC"). This does not mean that we are sponsored, recommended, or approved by the SEC, or that our abilities or qualifications in any respect have been passed upon by the SEC or any officer of the SEC. This commentary should not be considered a solicitation or offering of any investment product. Certain materials in this commentary may contain dated information. The information provided was current at the time of publication.
| Digg This Article
-- Published: Tuesday, 14 May 2019 | E-Mail | Print | Source: GoldSeek.com


 These 3 Charts Will Convince Investors That Time May Be Running Out