-- Published: Tuesday, 16 July 2019 | Print | Disqus

The market is now at record highs, and unemployment is way down. Even so, a U.S. rate cut is expected as early as this week. During his congressional testimony last week, Federal Reserve Chairman Jerome Powell raised concerns over slower global growth and trade tensions, which in turn have contributed to weaker demand and manufacturing activity. The most recent Global Manufacturing Purchasing Managers Index (PMI) showed that, at 49.4, factories contracted for the second straight month in June. We havent seen back-to-back sub-50.0 PMI readings since the second half of 2012.
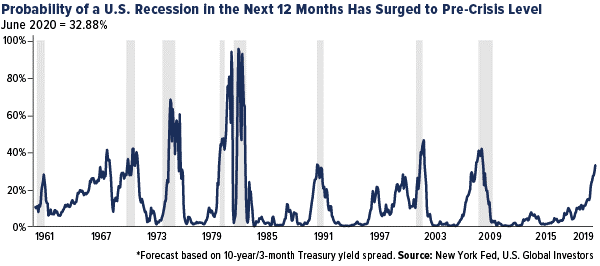
Theres also a one-in-three chance we could see a full-blown recession sometime next year. Thats according to the New York Feds recession probability index, which flashed a 12-year high of 32.9 percent last month. Since 1960, every time the index has surpassed 30 percent, the economy has tanked within the next 12 months.
Despite the risks, the U.S. economy is still expandingan unusual, though not unheard-of, time for the Fed to consider cutting rates.
So lets assume for a moment that the Fed does take action this year. What effect would that have on the stock market as well as manufacturing activity?
Thats precisely what analysts at market research firm Fundstrat looked into recently, and what they found is that 100 percent of the time, the market increased in the next three, six, nine and 12 months. The median gain over nine months, in fact, was nearly 18 percent.
Hypothetically, if the same thing were to happen today, that would put the S&P 500 Index at around 3,500 by next April.
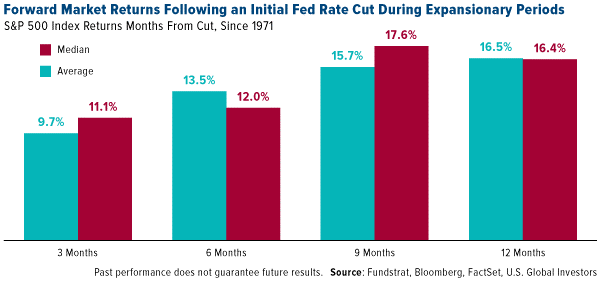
Once again, for those in the back: In every case going back to 1971, when the Fed began a new easing cycle while the economy was expanding, stocks went up three months, six months, nine months and 12 months later. No exceptions.
Manufacturers Looking for Tariff Relief
That wasnt the case with manufacturing activity. According to our own research, the ISM Manufacturing Index, which measures the U.S. sector, rose only a third of the time three months following a rate cut in good times. Six and nine months out, the index was up half the time. Twelve months out, it was higher about 66 percent of the time.
Those are decent odds, but a rate cut now would be much more favorable for stocks, statistically speaking.
To get manufacturing up to full capacity, I think there needs to be a resolution to the U.S.-China trade war. That was also the assessment of Renaissance Marco. In a note dated July 2, Neil Dutta, head of economics, observed that the word tariff featured prominently in purchasing managers June commentaries, suggesting trade issues were partly to blame for ISM weakness. If tariffs are indeed a driver of slower manufacturing growth, it would imply the ISM has room to pick up from here. After all, weve seen some relief over the weekend (China) and earlier in June (Mexico), Dutta wrote.
Bullish on Gold
If rate cuts are favorable for stocks, they can act as rocket fuel for the price of gold. As Ive explained many times before, the yellow metal has thrived in low-rate, weak-U.S. dollar environments.
Last week UBS reiterated the relationship between gold and interest rates, writing: Low to negative rates suggest falling cost of holding gold at a time when elevated trade and geopolitical uncertainty strengthen the case for diversification. Strategists Joni Teves, Roque Montero and Bhanu Baweja see gold hitting $1,450 an ounce by the end of this year and rising modestly to $1,500 in 2020.
TD Securities expects gold to average $1,400 for the rest of the year, followed by a lift toward $1,500 in the final months of 2020, driven by low to negative rates. One of President Donald Trumps picks for the Federal Reserve Board of Governors, Judy Shelton, is also constructive for gold, as she is in favor of lowering rates and supports a return to the gold standard.
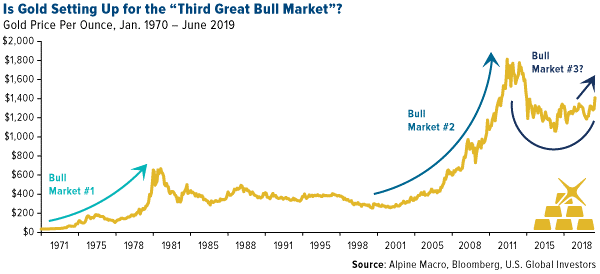
Finally, analysts at Alpine Macro see the beginnings of golds third great bull market of the post-war period. A rate cut by the Fed could set in motion a multi-year bear market in the dollar, analysts write, which is very supportive of gold. With the recent technical break above $1,400, new all-time highs for gold should be seen in the coming years, the research firm writes.
Curious to know which countries produce the most gold? Our ever-popular post has been updated with the latest data! Click here to see which country tops the list!
All opinions expressed and data provided are subject to change without notice. Some of these opinions may not be appropriate to every investor. By clicking the link(s) above, you will be directed to a third-party website(s). U.S. Global Investors does not endorse all information supplied by this/these website(s) and is not responsible for its/their content.
Standard deviation is a measure of the dispersion of a set of data from its mean. The more spread apart the data, the higher the deviation. Standard deviation is also known as historical volatility. J.P. Morgan Global Manufacturing PMI gives an overview of the global manufacturing sector. It is based on monthly surveys of over 10,000 purchasing executives from 32 of the world's leading economies, including the U.S., Japan, Germany, France and China which together account for an estimated 89 percent of global manufacturing output. It reflects changes in global output, employment, new orders and prices. The ISM manufacturing composite index is a diffusion index calculated from five of the eight sub-components of a monthly survey of purchasing managers at roughly 300 manufacturing firms from 21 industries in all 50 states. The S&P 500 Stock Index is a widely recognized capitalization-weighted index of 500 common stock prices in U.S. companies.
U.S. Global Investors, Inc. is an investment adviser registered with the Securities and Exchange Commission ("SEC"). This does not mean that we are sponsored, recommended, or approved by the SEC, or that our abilities or qualifications in any respect have been passed upon by the SEC or any officer of the SEC. This commentary should not be considered a solicitation or offering of any investment product. Certain materials in this commentary may contain dated information. The information provided was current at the time of publication.
| Digg This Article
-- Published: Tuesday, 16 July 2019 | E-Mail | Print | Source: GoldSeek.com


 Heres What the Market Did EVERY TIME the Fed Cut Rates During an Economic Expansion