-- Published: Wednesday, 12 February 2020 | Print | Disqus

Gold will outperform the S&P 500 Index in 2020. Thats one of several projections made by CLSA in its just-released Global Surprises 2020 report.
The Hong Kong investment firm has an impressive track record when it comes to making market predictionslast year it had a 70 percent hit rateso it may be prudent to take this one seriously.
CLSAs head of research Shaun Cochran: If investors are concerned about the role of liquidity in recent equity market strength
gold provides a hedge that could perform across multiple scenarios.
Indeed, gold is one of the most liquid assets in the world with an average daily trading volume of more than $112 billion, according to the World Gold Council (WGC). That far exceeds the Dow Jones Industrial Averages daily volume of approximately $23 billion.
The yellow metal, Cochran adds, can be particularly useful in an era of perpetually loose monetary policy: [I]n the event that growth disappoints the markets expectations, gold is positively leveraged to the inevitable policy response of lower rates and larger central bank balance sheets.
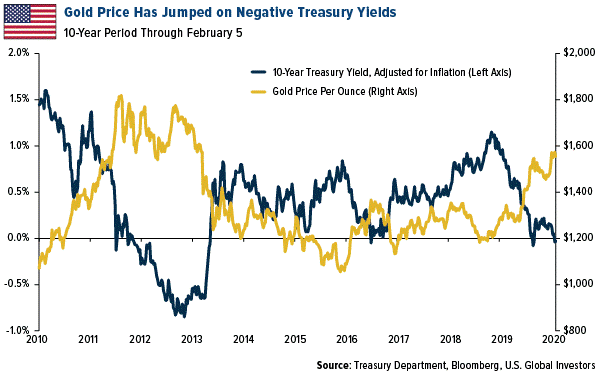
As Ive pointed out many times before, gold has traded inversely with government bond yields. The recent gold rally has largely been driven by the growing pool of negative-yielding government debt around the world, now standing at $13 trillion. Here in the U.S., the nominal yield on the 10-year Treasury has remained positive, but when adjusted for inflation, its recently turned negative, despite a strengthening economy. Whats more, the Federal Reserves balance sheet has begun to increase again. It now holds about 30 percent of outstanding Treasury debt, up from about 10 percent prior to the financial crisis.
I cant say whether gold will beat the S&P this year or next, but what I do know is that the yellow metal has been a wise long-term investment. For the 20-year period through the end of 2019, gold crushed the market two-to-one, returning 451.8 percent compared to the S&Ps 223.6 percent. That comes out to a compound annual growth rate (CAGR) of 8.78 percent for gold, 4.03 percent for the S&P.
Manufacturing Turnaround Has Begun
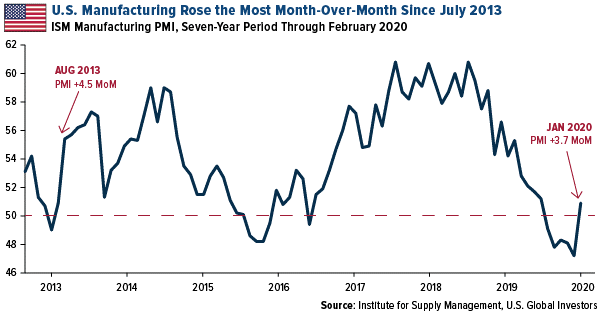
U.S. manufacturers started 2020 on stronger footing, a welcome turnaround after contracting for five straight months. Januarys ISM manufacturing purchasing managers index (PMI) clocked in at 50.9, indicating slight growth. Up from 47.2 in December, this represents the biggest month-over-month jump since August 2013, when the PMI increased to 55.4 from 50.9 in July.
This may also mark the end of the recent manufacturing bear market, prompted by the trade war between the U.S. and China. Although relations between the worlds two biggest superpowers remain strained, to say the least, weve seen improvements lately that hint at better days. Both sides signed a Phase One agreement in mid-January, and last week, China announced it would be cutting tariffs in half on as much as $75 billion of U.S.-imported products.
The coronavirus is a new development that has disrupted global trade, but theres reason to be optimistic, as the PMI makes clear.
To read my full comments on the coronavirus, and its impact on Chinese and Hong Kong stocks, click here!
The Dow Jones Industrial Average is a price-weighted average of 30 blue chip stocks that are generally leaders in their industry. The S&P 500 Stock Index is a widely recognized capitalization-weighted index of 500 common stock prices in U.S. companies. The Purchasing Managers Index is an indicator of the economic health of the manufacturing sector. The PMI index is based on five major indicators: new orders, inventory levels, production, supplier deliveries and the employment environment. Compound annual growth rate (CAGR) is a business and investing specific term for the geometric progression ratio that provides a constant rate of return over the time period.
All opinions expressed and data provided are subject to change without notice. Some of these opinions may not be appropriate to every investor. Some links above may be directed to third-party websites. U.S. Global Investors does not endorse all information supplied by these websites and is not responsible for their content.
U.S. Global Investors, Inc. is an investment adviser registered with the Securities and Exchange Commission ("SEC"). This does not mean that we are sponsored, recommended, or approved by the SEC, or that our abilities or qualifications in any respect have been passed upon by the SEC or any officer of the SEC. This commentary should not be considered a solicitation or offering of any investment product. Certain materials in this commentary may contain dated information. The information provided was current at the time of publication.
| Digg This Article
-- Published: Wednesday, 12 February 2020 | E-Mail | Print | Source: GoldSeek.com


 Gold Projected to Beat the Market in 2020