-- Published: Tuesday, 14 July 2020 | Print | Disqus

Every year around this time, we check in with raw materials for our popular commodities halftime report. This year, it wasnt even a competition.
Precious metals were the big winners for the first six months of 2020. Spot gold took the first place position, rising over 17 percent, followed in second place by silver, up nearly 2 percent. Palladium rounded out the top three, essentially flat at negative 10 basis points.
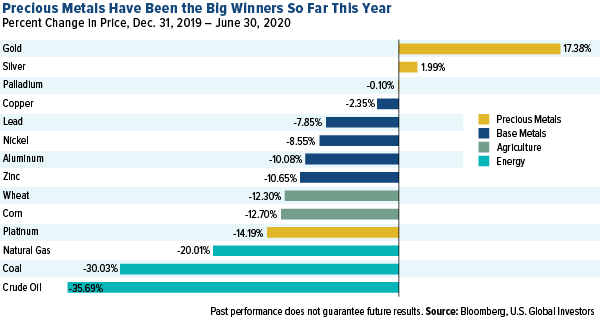
Platinumwhich, like palladium, is used in the production of emissions-scrubbing catalytic converterstrailed substantially behind its precious metal brethren for the six months as global auto sales plunged amid coronavirus lockdown measures.
However, that may be set to change. Automobile manufacturers in China, the worlds number two auto market, announced Friday that second-quarter sales increased more than 10 percent compared to the same period a year earlier. In fact, June sales in China hit a new record high, with 2.3 million vehicles sold.
Gold in a Secular Bull Market
Ready for $2,000 an Ounce?
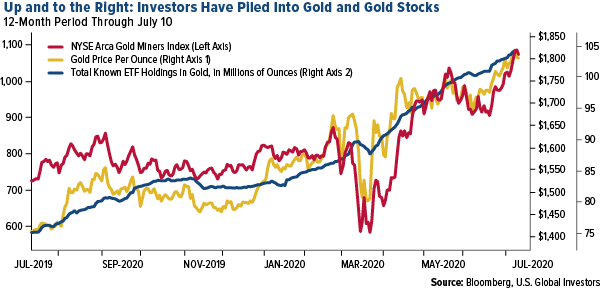
Gold had a phenomenal week, notching its fifth straight week of gains as investors sought a safe haven from sinking government bond yields. Last Tuesday, the yellow metal broke through the $1,800 an ounce resistance level for the first time since 2011. It touched a nine-year high of $1,828 on Wednesday before declining on profit-taking, but its clear to most analysts that the precious metal is in a secular bull market.
Many are now predicting all-time record highs for gold in the next 12 months, with Goldman Sachs forecasting $2,000 on an uneven recovery.
Go long copper, silver and steel, and stay long gold, Goldman analysts said in a note to investors last week.
Gold stocks and gold-backed ETFs continue to see incredible inflows during this rally. Gold mining seniors, as measured by the NYSE Arca Gold Miners Index, were up a phenomenal 145 percent for the 12-month period.
Meanwhile, holdings in total known gold-backed ETFs stood at a record 104.3 million ounces on July 9, the equivalent of more than 2,956 metric tons. To put that massive sum into perspective, 2,956 tons is more gold than any country on earth has in its official reserves, except for only two: the U.S. (8,133.5 tons) and Germany (3,363.6 tons).
In a note dated July 7, the World Gold Council (WGC) commented that the long-term investment case for gold remains intact.
The economic and geopolitical environment remains supportive for gold investment, with most of the existing gold demand drivers still relevant, says the London-based group, adding: The opportunity cost of holding gold remains low, as continued central bank activity keeps interest rates low or negative, while several countries continue to experience high levels of tension/unrest.
Indeed, the amount of negative-yielding global government bond yields has surged some 81 percent since March 19 and now stands at just under $14 trillion, the most since early March.
Silver has likewise been catching a bid. The white metal touched $19.37 an ounce last week, just below its 52-week high of $19.54.
Global Manufacturing Heading in the Right Direction, Constructive for Base Metals
Base metals all ended lower for the six months as COVID-19 all but brought manufacturing to a halt and shuttered factories across the globe.
I say this with caution, but there could be some good news ahead. The JPMorgan Global Manufacturing PMI, which tracks manufacturing activity around the world, posted a 47.8 in June. Although that doesnt quite indicate expansion, it means that factories are contracting at a much slower rate than they were in the two previous months. Whats more, Junes gain was the strongest on record for a single month, up 5.4 points from 42.4 in May, indicating a recovery could be underway.
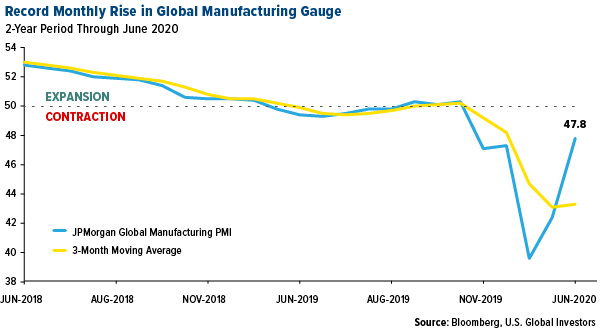
On a country-by-country basis, manufacturing growth was strongest in China, France, Italy, the United Kingdom and (interestingly) Brazil, which has been among the hardest hit by the virus.
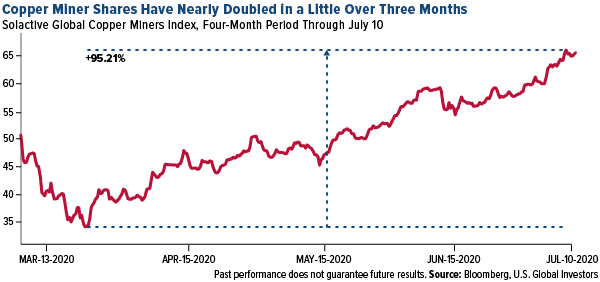
Chinas manufacturing PMI reading in June, at an expansionary 51.2, was its highest for 2020 so far. As the worlds largest consumer of base metals, Chinas improvement is highly constructive for the group. Zinc posted its biggest weekly gain since 2016, advancing 8.22 percent, largely in response to the positive news. Copper, meanwhile, has surged some 33.5 percent since its 52-week low of $217 a pound on April 21. Copper miners, as measured by the Solactive Global Copper Miners Index, have fared even better, soaring more than 95 percent since its recent low on March 23 as Chinese copper smelters crank up production.
Energy Lagged. A Buying Opportunity?
Energy was the worst performing S&P 500 sector of the first half of the year, falling as much as 35.3 percent, just beating banks, which sank 34.9 percent. Natural gas, coal and oil were all down more than 20 percent for the six-month period as travel restrictions were put in place and demand forecasts deteriorated. Back in April, I shared with you IHS Markits prediction that global oil supply would exceed demand by more than a staggering 1.8 billion barrels in H1 2020. Last week we learned that storage tanks and vessels in Iran, one of the worlds leading crude exporters, are nearing full capacity.
Like other distressed sectors and industries, including airlines, this could be a huge buying opportunity.
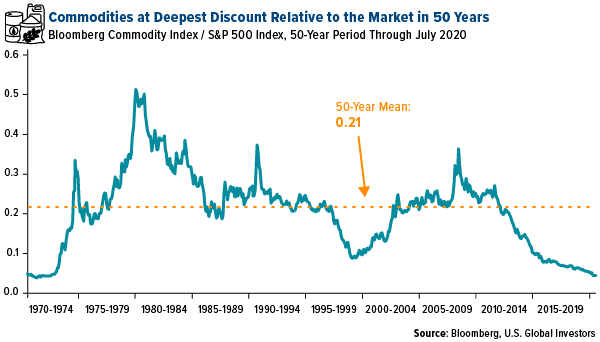
Below is the ratio between the Bloomberg Commodity Index and the S&P 500. What it shows is that raw materials, and particularly energy, are at their deepest discount relative to the market in half a century.
All opinions expressed and data provided are subject to change without notice. Some of these opinions may not be appropriate to every investor. By clicking the link(s) above, you will be directed to a third-party website(s). U.S. Global Investors does not endorse all information supplied by this/these website(s) and is not responsible for its/their content.
The S&P 500 Stock Index is a widely recognized capitalization-weighted index of 500 common stock prices in U.S. companies. The JPMorgan Global Manufacturing PMI provides the first indication each month of world manufacturing business conditions. The Solactive Global Copper Miners Index includes international companies active in exploration, mining and/or refining of copper. The index includes a minimum of 20 and a maximum of 40 members. The calculation is done in USD as a total return index. Index adjustments are carried out semi-annually. The Bloomberg Commodity Index (BCOM) is calculated on an excess return basis and reflects commodity futures price movements. The index rebalances annually weighted 2/3 by trading volume and 1/3 by world production and weight-caps are applied at the commodity, sector and group level for diversification.
A basis point is one hundredth of one percent, used chiefly in expressing difference of interest rates.
Holdings may change daily. Holdings are reported as of the most recent quarter-end. None of the securities mentioned in the article were held by one or more accounts managed by U.S. Global Investors as of (06/30/2020).
| Digg This Article
-- Published: Tuesday, 14 July 2020 | E-Mail | Print | Source: GoldSeek.com


 Precious Metals Were the Winners in H1 2020